We begin with a quick glimpse of the global climate — and then we’ll try to understand why it looks this way. But first, what does climate mean? In the simplest sense, it is the average weather of a region — the average temperature, rainfall, air pressure, humidity, cloud cover, wind direction, and wind speed. This means that climate is not the same as weather; weather implies a very short-term description of the atmospheric conditions, and it tends to change in a complex manner over short time scales, making it notoriously difficult to predict. In contrast, the climate is less variable — it smoothens out the variability of the short-term weather. This course is about climate, how it is changing, and what that means for our future; as we move through this class, you should remind yourself periodically that we are not talking about the weather — our time frame is much longer.
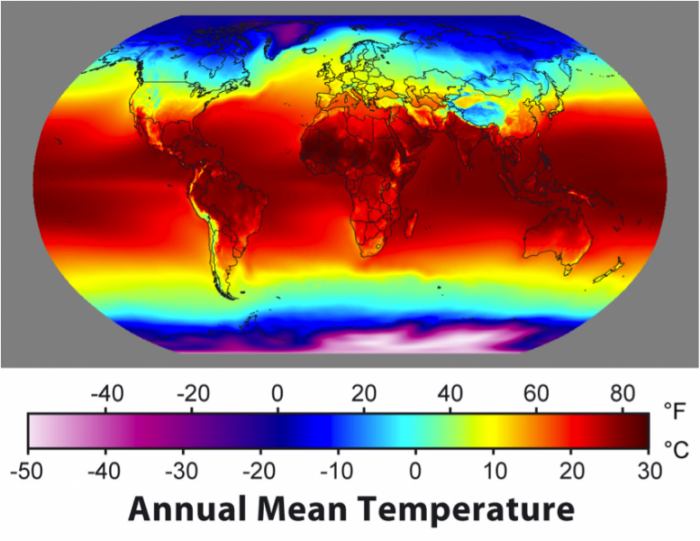
So, let’s have a look at the climate as expressed by temperature:
As you can see, the equatorial regions are the warmest, and the poles are the coldest, with Antarctica being noticeably colder than the Arctic. The temperature varies more within the continents than the oceans, and there is a pronounced northward extension of warm water in the North Atlantic.
The global climate system is like a big machine receiving, moving, storing, transferring, and releasing heat or thermal energy. The machine consists of the oceans, the atmosphere, the land surface, and the biota on land and in the oceans; in short, it consists of everything at the Earth’s surface. The average state of this system — the global climate — is represented most simply by the pattern of temperatures and precipitation at the surface.
In order to really understand this complex machine, we will have to understand something about its parts, but we also need to begin with some fundamental ideas about energy, heat, and temperature, including the source of the energy for the climate system — the sun.
Useful Terms and Definitions Related to the Energy of the Climate System
Energy
In the broadest terms, energy is a quantity that has the ability to produce change in a physical system; it includes all kinds of kinetic energy (energy of motion) and potential energy (energy based on the body's position) and is measured in joules. One joule represents the amount of energy needed to exert a force of one Newton over a meter; so 1 Joule = 1Nm.
Power
Energy expended over a period of time is a measure of power, and in the context of climate, power is expressed in terms of Watts (1 Watt = 1 joule per second). This is also called a heat flux — the rate of energy flow.
Heat
This is simply the thermal energy of a body, measured in joules. Think of this as the average kinetic energy (vibrations) of the atoms of a material.
Heat Flux Density
This is a measure of how concentrated the energy flow is and is given in units of Watts per square meter.
Temperature
This is obviously closely related to heat, but it is the average kinetic energy within somebody. Materials can be the same temperature, but they may have different amounts of thermal energy — for instance, a volume of water has much more thermal energy than a similar volume of air at the same temperature. Remember that there are 3 temperature scales: Fahrenheit, Celsius, and Kelvin. We’ll use Celsius and Kelvin, which have the same scale, just offset so that 0°C = 273°K.