One of the central concepts in geography is scale. In very rough terms, scale refers to how big or small something is. That "something" could be an event, a process, or some other phenomenon. In geography, we often focus on spatial scale. Spatial scale is the extent of an area at which a phenomenon or a process occurs. For example, water pollution can occur at a small scale, such as a small creek, or at a large scale, such as the Chesapeake Bay. Spatial scale also refers to the area or spatial extent at which data about a phenomenon are aggregated to be analyzed and understood. For example, while there are differences in levels of pollution in different areas of the Chesapeake Bay, one may choose to aggregate water quality measurements to make a general statement about pollution in the bay as a whole.
Geographers not only are interested in the patterns of physical or social processes on the Earth at a given level of spatial organization (e.g., local, regional, or global), but they also want to know the interactions and feedbacks across different spatial scales. Geographers sometimes also discuss temporal scale, which is the duration or time length of a thing or process. Some examples can help us understand scale. Consider air pollution. This often exists at the scale of a city or metropolitan area. The city will have cars, factories, power plants, and other things that cause air pollution, and the air pollution will affect people who live in the city and breathe the air there. People elsewhere may not be significantly affected. (Note that sometimes the wind sends air pollution further away.) In contrast, climate change largely exists at the global scale. (We'll discuss climate change in greater detail later in the course.) This is because climate is a process that covers the whole planet. When we change the climate somewhere, we change it everywhere. Scale matters in understanding the interactions between humans and the environment.
A nice depiction of scale can be found in the following video (9:01):
PRESENTER: The picnic near the Lakeside in Chicago is the start of a lazy afternoon, early one October. We begin with a scene one meter wide, which we view from just one meter away. Now every 10 seconds, we will look from 10 times farther away, and our field of view will be 10 times wider. This square is 10 meters wide. And in 10 seconds, the next square will be 10 times as wide. Our picture will center on the picnickers, even after they've been lost to sight.
100 meters wide, a distance a man can run in 10 seconds. Cars crowd the highway. Powerboats lie at their docks. The colorful bleachers are Soldier Field. This square is a kilometer wide, 1,000 meters. The distance a racing car can travel in 10 seconds. We see the great city on the lake shore. 10 to the fourth meters, 10 kilometers, the distance a supersonic airplane can travel in 10 seconds.
We see first the rounded end of Lake Michigan, then the whole great lake. 10 to the fifth meters, the distance an orbiting satellite covers in 10 seconds. Long parades of clouds. The day's weather in the Middle West. 10 to the sixth, a one with six zeros. A million meters.
Soon the Earth will show as a solid sphere. We are able to see the whole Earth now, just over a minute along the journey. Earth diminishes into the distance, but those background stars are so much farther away. They do not yet appear to move.
A line extends at the true speed of light, in one second it half crosses the tilted orbit of the moon. Now we mark a small part of the path in which the Earth moves about the sun. Now the orbital paths of the neighbor planets, Venus and Mars, then Mercury. Entering our field of view is the glowing center of our solar system, the sun.
Followed by the massive outer planets, swinging wide and their big orbits. That odd orbit belongs to Pluto. A fringe of a myriad comets too faint to see completes the solar system. 10 to the 14th. As the solar system shrinks to one bright point in the distance, our sun is plainly now only one among the stars.
Looking back from here, we know four Southern constellations still much as they appear from the far side of the Earth. This square is 10 to 16th meters, one light year. Not yet out to the next star. Our last 10 second step took us 10 light years further. The next will be 100. Our perspective changes so much in each step now, that even the background stars will appear to converge.
At last we pass the bright star Arcturus, and some stars of the Dipper. Normal but quite unfamiliar stars and clouds of gas surround us as we traverse the Milky Way galaxy. Giant steps carry us into the outskirts of the galaxy. And as we pull away, we begin to see the great flat spiral facing us. That time and path we chose to leave Chicago has brought us out of the galaxy along a course nearly perpendicular to its disk.
The two little satellite galaxies of our own are the clouds of Magellan. 10 to the 22nd power, a million light years. Groups of galaxies bring a new level of structure to the scene. Glowing points are no longer single stars, but whole galaxies of stars seen as one. We passed the big Virgo cluster of galaxies among many others, 100 million light years out. As we approach the limit of our vision, we pause to start back home.
This lonely scene, the galaxies like dust, is what most of space looks like. This emptiness is normal. The richness of our own neighborhood is the exception. The trip back to the picnic on the lakefront will be a sped up version, reducing the distance to the Earth's surface by one power of 10, every two seconds. In each two seconds, we'll appear to cover 90% of the remaining distance back to Earth.
Notice the alternation between great activity and relative inactivity, a rhythm that will continue all the way into our next goal, a proton in the nucleus of a carbon atom beneath the skin on the hand of a sleeping man at the picnic. 10 to the ninth meters, 10 to the eighth. Seven, six, five, four, three, two, one. We are back at our starting point. We slow up at 1 meter, 10 to the zero power.
Now we reduce the distance to our final destination by 90% every 10 seconds. Each step much smaller than the one before. At 10 to the minus 2, one one-hundredth of a meter, one centimeter, we approach the surface of the hand. In a few seconds we'll be entering the skin, crossing layer after layer from the outermost dead cells into a tiny blood vessel within. Skin layers vanish and turn, an outer layer of cells, felty collagen.
The capillary containing red blood cells in a roughly lymphocyte. We enter the white cell, among its vital organelles, the porous wall of the cell nucleus appears. The nucleus within holds the heredity of the man in the coiled coils of DNA. As we close in, we come to the double helix itself, a molecule like a long twisted ladder, whose rungs of paired bases spell out twice in an alphabet of four letters, words of a powerful genetic message.
At the atomic scale, the interplay of form and motion becomes more visible. We focus on one commonplace group of three hydrogen atoms bonded by electrical forces to a carbon atom. Four electrons make up the outer shell of the carbon itself. They appear in quantum motion as a swarm of shimmering points. At 10 to the minus 10 meters, one angstrom, we find ourselves right among those outer electrons. Now we come upon the two inner electrons held in a tighter swarm.
As we draw toward the atom's attracting center, we enter upon a vast inner space. At last, the carbon nucleus, so massive and so small, this carbon nucleus is made up of six protons and six neutrons. We are in a domain of universal modules. There are protons and neutrons in every nucleus. Electrons in every atom. Atoms bonded into every molecule out to the farthest galaxy.
As a single proton fills our scene, we reach the edge of present understanding. Are these some quarks at intense interaction? Our journey has taken us through 40 powers of 10. If now the field is one unit, then when we saw many clusters of galaxies together, it was 10 to the 40th, or one and 40 zeros.
The video shows the same point in space on a broad range of scales, from the subatomic to the astronomical. In geography, we tend to focus on human scales, which are the scales of the world as we experience it. So, you will not need to know any particle physics or astronomy for Geog 30N, even though some of it may be relevant!
It is important to appreciate that phenomena can be considered or observed at multiple scales. For example, we can observe climate change at the global scale, since climate is a global process. However, we can also observe climate change at local scales. Climate change is caused by, among other things, many individual decisions to burn fossil fuels. Also, climate change impacts people and ecosystems in specific local places across the world. The causes and impacts are different in different places. If we only observed climate change at the global scale, we would miss this variation from one location to another. It's important to observe climate change - and many other important phenomena - at many scales so that we can fully understand what's going on.
Another example important to Geog 30N is deforestation. As with climate change, it helps to consider deforestation on many scales. An individual living in the Brazilian Amazon might decide to cut down a tree to collect firewood, to sell the wood, or to clear land for farming. If we think of deforestation just at this local scale, then we might understand it as a local event. However, the decision to cut down the tree can be connected to other political, economic, cultural, and environmental processes that operate at national, regional and international scales. For example, the decision to cut the tree is shaped in part by external economic markets: whether the tree could be sold for money, or whether the person could make money from engaging in other activities that require clearing patches of forest, such as raising cattle for beef. Trade agreements between Brazil and other countries shape the systems of economic exchange, and international demand for hardwoods such as mahogany (in the United States and Europe in particular) create incentives to deforest tropical rainforests. Therefore, the simple act of cutting down a tree in Brazil needs to be seen as connected to other economic and political processes that intersect and move across multiple scales.
The deforestation example highlights the important concept of globalization. Globalization is a hotly debated concept, but it is generally understood as the increasing integration of societies around the world through improvements in transportation and communication technologies. The integration can be economic, political, or cultural. Here are some examples:
* Economic Integration: Global freight shipping permits Brazilian trees to be sold to European consumers.
* Political integration: American environmental policies may limit the types or quantities of trees that can be imported from Brazil.
* Cultural integration: Globalized tastes for food can lead people from around the world to desire food products that can be grown in Brazil.
Globalization has impacted societies around the world as the sharing of products has contributed to the perception that cultures are losing their individuality.
One way to approach understanding relationships across scales is through commodity chains. A commodity chain contains the links between the collection of resources to their transformation into goods or commodities and, finally, to their distribution to consumers. Commodity chains can be unique depending on the product types or the types of markets (agriculture versus textiles for example). Different stages of a commodity chain can also involve different economic sectors or be handled by the same business. Figure 1.1 visualizes a simplified commodity chain for the seafood industry.
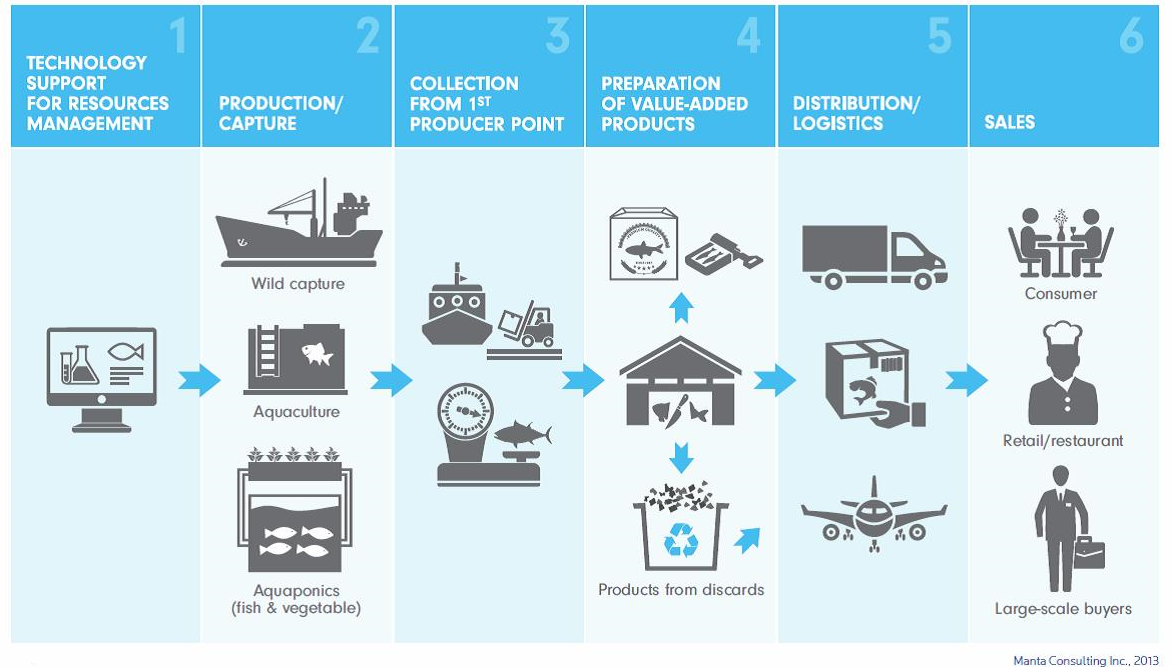
Click here to see a text version of Figure 1.1
Flowchart of the seafood supply chain:
1. Technology support for resources management leads to
2. Production/Capture: wild capture, aquaculture, aquaponics (fish & vegetable) leads to
3. Collection from 1st producer point leads to
4. Preparation of value-added product (ex. Butchering, packaging and waste) leads to
5. Distribution/Logistics (ex. Truck, plane etc) leads to
6. Sales: consumer, retail/restaurant/large-scale buyers.
Understanding the path that fish took on its way to our plates as it moves across the commodity chain allows us to think about the interconnections between capture/production (wild fisheries vs. aquaculture), generation (converting whole fish to other product forms such as fish fillets or canned fish), distribution and sales (transferring products to locations for consumption and selling products to consumers).
Consider This:
When you buy seafood, do you ask yourself, "Where does my seafood come from and how does it get to me?" Look at Figure 1.1 and try to place yourself on this supply chain. Where do you exist in terms of the production and consumption of seafood?
As we'll discuss in later modules, the global rise in seafood demand has caused the depletion of fish stocks. Unsustainable overfishing has emerged as a global issue and has its severe and irreversible impacts on human lives and marine biodiversity. As with fishermen catching more fish than the population can replace through natural reproduction, we need to think about our individual decisions and local patterns that contribute to sustainable practice. Our decisions and food choice are also linked to political and economic processes at multiple scales, but we need to think about the types of impacts our individual decisions have for the natural world.