Lesson 2: PV System Components (PV Module)
Overview
Lesson 2 Scenario
Imagine this: you work for the procurement team for a solar company and your director asks you to attend one of the biggest international solar trade shows (i.e.. Solar Power International), where you are networking with PV manufacturer representatives to learn about new material and technology advancement. You come across a Solar Module booth, so you start talking about your team and what types of PV systems you offer to clients. The representative starts going over data-sheets and the series of PV modules they make.
What are the questions you can ask to narrow down your choices of PV modules? Is it PV technology type, efficiency, or the voltage and current of modules that is most important?
You continue walking and stop by other booths, where you get the same exact power rating information from the representatives. Now you have to select a few panels by comparing their specifications. Ignoring the cost of the modules, what factors dictate your decision to select the panel? Is it module efficiency, color, or dimensions?
You leave the trade show with more specification sheets from other PV manufacturers. The next day you need to prepare a report to your director, who needs more numbers to help evaluate each panel. Since it is not easy to test the actual modules’ performance, are there tools or software that you can use to learn more about the annual energy production of these PV modules?
It is obvious to us that PV modules should generate more energy when there is more sun. However, are there any other factors that affect the performance of these PV modules when they are installed? Can it be the orientation of modules or the ambient temperature? Are there any methods to optimize the performance of the PV system?
Since you are a company operating in the US, can any module be installed, or should it meet some kind of test standards and certifications?
In this lesson, we will discuss topics that lead to answers to all the questions in the scenario above. We will enlighten PV designers to look for the best modules that fit their application.
Learning Outcomes
At the successful completion of this lesson, students should be able to:
- Identify PV terminology and key electrical characteristics of PV modules at various operating conditions.
- Interpret a PV module manufacturer's data specification sheet and key parameters for various test standards.
- Discuss factors affecting performance of PV devices and the impact of changing irradiance and temperature.
- Apply strategies to optimize production of PV systems using industrial tools such as Solar Advisor Model (SAM) and PVwatt software to simulate PV output.
- Identify shading effects on PV array and series and parallel connection of modules.
What is due for Lesson 2?
Lesson 2 will take us one week to complete. Please refer to the Calendar in Canvas for specific timeframes and due dates. Specific directions for the assignments below can be found within this lesson and/or in Canvas.
Complete the following Lesson Assignments:
- Read through the Lesson Content
- Complete the Required Reading Assignments:
- Chapter 5, Photovoltaic Systems by James P. Dunlop (text)
- Look over the Recommended Readings:
- Chapter 14, Jeffrey Brownson "Solar Energy Conversion Systems" [1] (*Penn State Login Required)
- Review two articles on the Photovoltaic Education Network:
- Go to PVCDROM [2].
- On the left side of the page under Instructions" click on "7. Modules and Arrays"
- Please review "7.2. Interconnection Effects" and "7.3. Temperature Effects"
- Complete the Lesson 2 Activity
- Begin working on your Procurement Report
- Take the Lesson 2 Quiz in Canvas
*Students who register for this Penn State course gain access to assignments, all readings, and instructor feedback, and earn academic credit. Information about registering for this Penn State course is available through the Renewable Energy and Sustainability Systems Online Masters and Graduate Certificate Programs Office [3].
Questions?
If you have lesson specific questions, please feel free to post to the Lesson 2 Questions discussion forum in Canvas. While you are there, feel free to post your own responses if you, too, are able to help a classmate with a question. If you have questions about the overall course or wish to share and discuss any "extra" course related commentary (interesting articles, etc.), please feel free to post to the General Questions and Discussion forum.
Review
Some of the content in AE 868 is directly related to topics that are already discussed in other courses. However, these topics are essential building blocks on what we will cover in AE 868. Many lessons will begin with a list that links out to these relevant topics. Please take the time to review the topics here or where noted throughout the lesson.
- EME 810 (Lesson 2: Collector Orientation) [4]
- EME 810 (Lesson 2: Sky Dome and Projections) [5]
- EME 810 (Lesson 2: Applying Shading to a Solar Chart) [6]
- EME 810 (Lesson 6: Project Locale) [7]
- EME 812 (Lesson 3: Tracking Systems) [8]
- EME 812 (4.1 Photovoltaic effect) [9]
- EME 812 (4.2 P-N Junction) [10]
- EME 812 (4.3 How PV performance is measured) [11]
- EME 812 (4.4 PV systems across scale) [12]
- EME 812 (4.5 Types of PV technology and recent innovation) [13]
- EME 812 (6.2 Main components of the PV systems) [14]
- EME 812 (11.3 DC/DC Conversion) [15]
PV Module Performance Characteristics
We recall from previous classes that in order for us to understand Photovoltaic technology, we need to understand its main properties at the cell level such as the Photovoltaic effect, the P-N Junction to simply convert light into electricity, and how PV performance is measured in terms of current and voltage (I-V) curve, Filling factor (FF), and efficiency.
In this section, we will revisit some of these performance characteristics, such as I-V, P-V, FF, and efficiency, at the module level.
Before we start, let us define some of the commonly used terminologies in solar at the system level.
Review:
To learn more about the basics of PV in detail, you can refer to EME 812 (4.1 Photovoltaic effect) [9] and EME 812 (4.2 P-N Junction) [10].
Modules and Panels
In this lesson, we will focus on the centerpiece of any PV system, which is the PV module. Solar modules or solar panels are two commonly used terms in the solar industry. Many people use these terms interchangeably, but there is a small difference that should be discussed. A module is the series and/or parallel interconnection of solar cells in a circuit, on a panel. The term solar panel is more exclusive to the rectangular, rigid packaging frame. Most standard crystalline modules can be called solar panels. In general, all solar panels are solar modules, but the opposite is not always true. For example, a thin-film silicon solar cell that is packaged as a flexible laminate is a solar module, but it is not a panel.
Array
Another important term to consider is PV array. When modules are installed as a system, that layout is called an array. Arrays can also be connected in parallel or in series similar to modules and cells.
Review:
To learn more about cell series and parallel characteristics, you can refer to EME 812 (4.4 PV systems across scale) [12]. In addition, Chapter 14 of Jeffrey Brownson's Solar Energy Conversion Systems dives into more of these terms in greater detail. (Note: a link to the reading is available under "Recommended Readings" on the first page of the lesson.)
A Module's Main Parameters
Since a solar module is nothing but an interconnection of solar cells, similar parameters are defined such as module Efficiency, module Fill Factor, Maximum Power Point (MPP) Voltage and Current (Vmpp) and (Impp), Open Circuit Voltage (Voc), and Short Circuit Current (Isc).
Voltage and Current of a Module
As we can see, the total voltage of a PV module is nothing but a scale version of the cell voltage (multiplied by a number of cells connected in series), while the total current is a scaled version of the cell current (multiplied by a number of strings of cells connected in parallel).
Module I-V characteristics
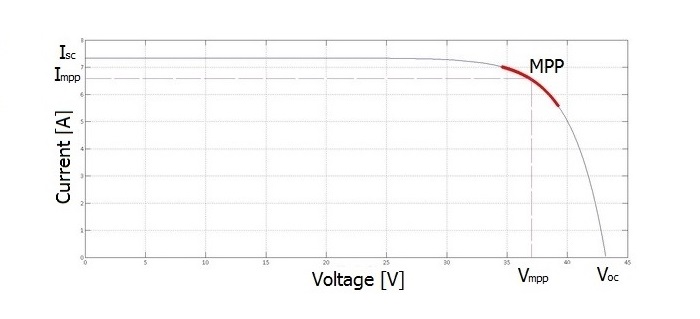
Previously, we learned about the I-V (J-V in some references, “J” being the current density, current per unit area) curve at the solar cell level. However, in PV systems, we are more interested in the total current and voltage that the PV module can generate, so we define the Module I-V curve, or the current-voltage curve, as it is illustrated in Figure 2.1. The curve indicates the voltage and current at different operating conditions. For example, the highest current corresponds to the short-circuit condition (when a PV module's positive and negative terminals are connected without load, causing very high current to pass), while the highest voltage occurs at open-circuit condition (when a PV module's positive and negative terminals are not connected to any load, causing no current to pass). If we observe the current and voltage starting at the open-circuit condition (where voltage is maximum and current is zero), and as we increase the load of the circuit, the current starts increasing and the voltage falls down until it reaches the value of zero at short-circuit condition (where the current is maximum). The knee of the curve indicates the operating condition in which current and voltage result in maximum power point (MPP). The voltage and current values at MPP are referred to as "Vmpp” and “Impp,” respectively.
Review:
To learn more about the current and voltage relationship in detail, you can refer to EME 812 (4.3. How PV performance is measured) [11].
Module P-V characteristics
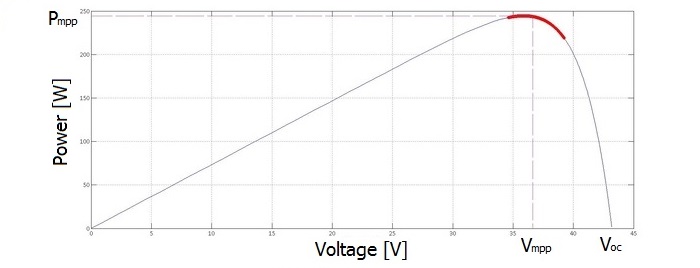
Another way to visualize the I-V curve is to convert it to a relationship between power and voltage. In this case, we can call it (P-V) curve of PV module, as shown in Figure 2.2. Similar to an I-V curve, the highest voltage occurs at the open-circuit condition and the current is zero and the short-circuit voltage is zero at the origin of the curve, but the current is maximum. Since the power is nothing but the voltage times the current (P=VxI), the power at both the short-circuit and open-circuit conditions is equal to zero since either voltage or current equals zero at each of these points. If we observe the power and voltage starting at the open-circuit condition (where the voltage is maximum and power is zero), and as we increase the load of the circuit, the power starts increasing and the voltage falls down until it reaches the value at MPP (where power is maximum). If we increase the load further, the voltage keeps falling down. However, the power will decrease as well until it reaches the value of zero at short-circuit condition (where the both voltage and power are zero). It can be seen that it is much easier to find the peak power on the P-V curve in comparison to the I-V curve, as it resembles a hump. The power at MPP is referred to as "Pmpp."
Reflection
In Figures 2.1 and 2.2, what does the highlighted red line on the I-V and P-V curves refer to?
ANSWER: The highlighted red line shows the range the voltage can vary around the Maximum Power Point (MPP).
Other Parameters of PV Modules
But what about the other parameters, such as efficiency and fill factor of a solar module? Do they increase, decrease or stay the same in comparison to the cell values? Ideally, all cells have similar characteristics with no mismatching losses; in this case, we expect the efficiency and fill factor at both of the module and cell levels to be the same. But this is not true in practice due to various factors that play a role when cells are interconnected, such as the series resistance caused by contacts soldering between cells. Furthermore, there might be a small manufacturer mismatch in the characteristics of the cells that are interconnected. In this case, the cell with the lowest current in the string in series dictates the current of the module. Similarly, the cell with the lowest voltage in parallel dictates the voltage of the module. This mismatch in cells can be a result of the non-homogeneity of the cells due to mass production.
Another main cause of mismatch occurs when a module is:
- partly shaded, or
- has non-uniform irradiance, or
- has non-uniform heating on the cell level.
Therefore, each module in practice performs a little different compared to the expected performance of the ideally matched solar cells.
So how does this affect the parameters of the Module?
Most module manufacturers list in their datasheets the difference between module and cell level efficiency. For example, the datasheet of the Sanyo HIT-N240SE10 [16] module states that cell efficiency is 21.6% and that module level efficiency is around 19%.
Review:
To learn more about the cell technology and efficiency in detail, you can refer to EME 812 (4.5 Types of PV technology and recent innovation) [13].
Wiring within a PV Module and the Shading Effect
Cells layout in a PV Module
PV modules consist of cells, which are sensitive to solar radiation. In order for us to maximize the solar utility of this module when it is installed, we should understand how these cells are wired inside the PV module. Furthermore, it is important to define the factors that contribute to the performance of these cells.
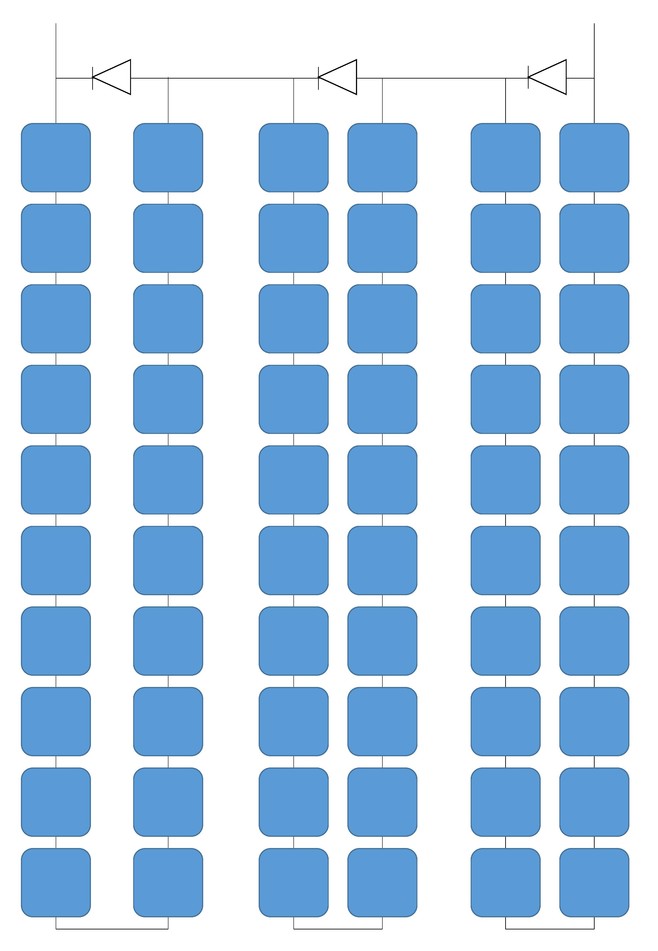
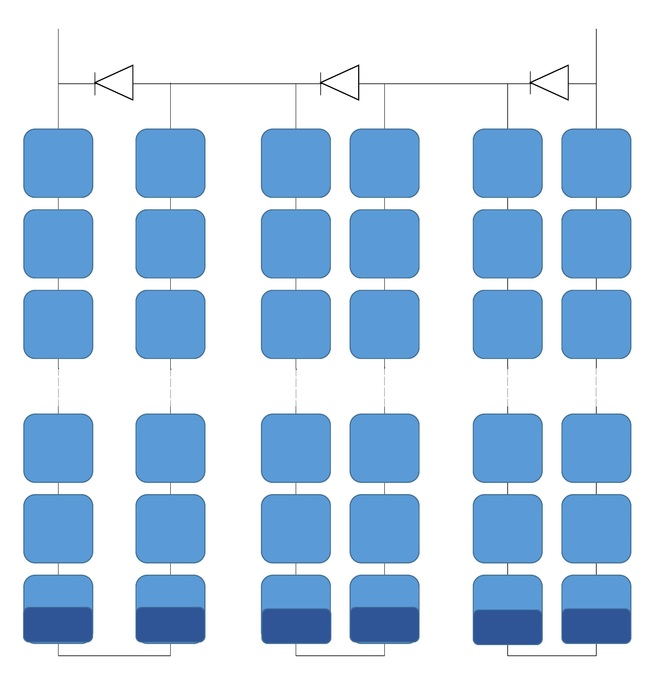
This section will discuss how shading affects the output of solar modules and will also discuss the available solutions to overcome that issue. First of all, let’s start with the wiring of PV cells inside a PV module as shown in Figure 2.3, where the cell connections for a typical commercial 250W panel with 60 cells is illustrated. The PV cells are divided into three groups, and each group of 20 cells has a dedicated bypass diode (illustrated with the triangular shape on top of each group that will be discussed in the next section). When all PV cells are wired in series (the positive of the first cell connects to the negative of the second cell) and then encapsulated within a frame, it forms a PV module with two terminals that are referred to as the positive and negative terminals.
As we expect, all cells are wired in series to get to the desired voltage level of the PV module. However, this series connection raises an issue that when one cell is not generating power due to shading, for example, it will not be able to generate the same amount of current that other similar (unshaded) cells generate. And due to series connection, the total current of the module will be dictated by the weakest cell (shaded). As a result, that will create power loss due to current restriction. In addition, when the higher current generated by unshaded cells tries to pass through the shaded cell, the shaded cell might act like a load and the temperature will increase, and that might lead to a phenomenon known as “hot spot.” Hot spots cause physical damage within the module, like melted cells, cracked glass, or changing characteristics of cells.
Reflection
Why does a shaded cell in series act like an electrical load?
ANSWER: The electrical explanation is that the shaded cell will work on reverse-biased diode mode when connected in series with active cells, that will result in it acting like a load instead of a solar generator.
Bypass Diode
With this said, there should be a solution to protect the modules and cells from the hot spot and also improve the extracted output power when cells are shaded. This can be resolved by adding a “bypass diode” across the shaded cell. In this case, the diode will pass the current and no current will go through the shaded cell. This leads to another important question, how do manufacturers add bypass diodes? Do they add to each cell within the module?
Reflection
How does the bypass diode works, and how dies current pass through it instead of the shaded cell?
ANSWER: When a diode is wired across a cell or group of cells, it is chosen to have the forward biased voltage equal the cell voltage. When the cell is not shaded, it generates voltage that will apply across the bypass diode in reverse biased that will lead to the diode not allowing current to pass through it. When the cell is shaded, its voltage drops across the diode, and that will allow forward biased to apply over the diode. This will lead to the current passing through the diode instead of the shaded cell.
A bypass diode to each cell is not an economical question, and due to the layout of the cells on the panel, the optimal way the bypass diodes are added is as illustrated in Figure 2.4. We can see that the module is divided into groups of cells and each group will have a single bypass diode. In our particular example, we have 3 bypass diodes for the 60 cells module so each 20 series connected cells are protected by one bypass diode.
Is there a difference when cells are shaded with different patterns across the module? Yes - there is a significant impact of the shading pattern, and that is due to the way the bypass diodes are physically connected. Let’s discuss this example: What if only one cell is shaded, as shown in Figure 2.4?
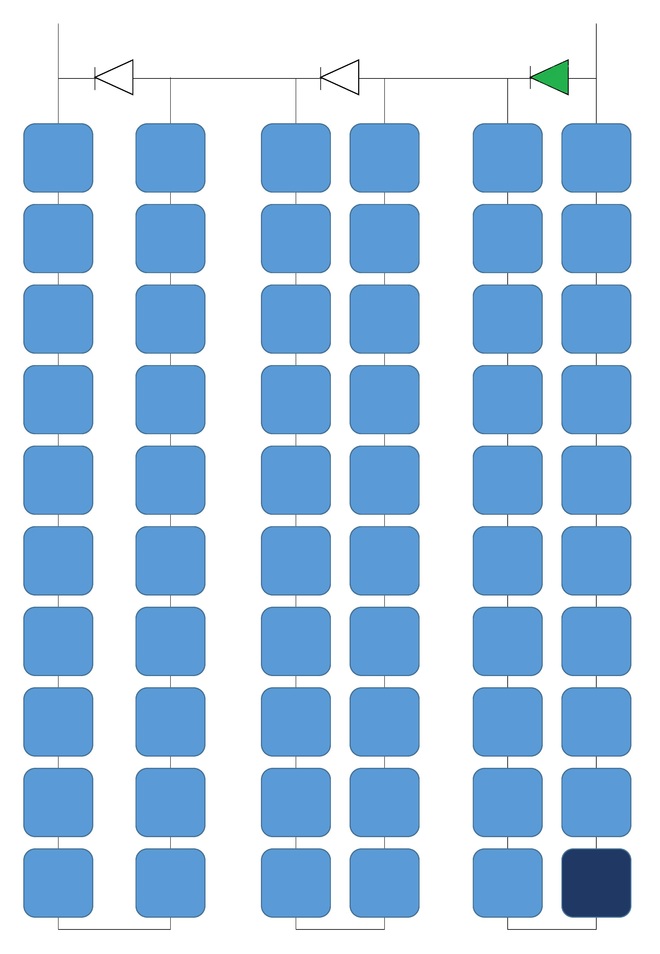
In this case, the string with the shaded cell will not contribute to the total voltage and power of the module; we can estimate that the module might lose 30% of its voltage and power.
Reflection
How does one partly shaded row that shades an equal number of cells from each group affect the voltage of the module?
ANSWER: In this case, the module will not lose voltage since the groups are equal in voltage and none of the bypass diodes will be activated. However, the current flowing through each group will be limited to the lowest current of the weakest cell. The shading pattern is shown in Figure 2.5.
Wiring at PV Array and Shading Effect
Connections at the Module Level
Now that we have covered the basics of series and parallel connections of PV cells when we discussed the I-V characteristics, it is time to understand the bigger picture by investigating the connections at the module level. In this lesson, we will define a new commonly used term in the solar PV industry, which is the PV string. We will look at how the total voltage and current characteristics change as a result of these formations. In addition, we will discuss how characteristics are affected by the pattern of shading applied to the PV system.
A PV string is formed when multiple modules are connected in series. In this case, the string I-V curve is the same as the individual I-V curve of each module, but it is scaled in voltage by the number of modules connected in series while the current stays similar to the individual module’s current. PV strings can be as small as one module, or can have multiple numbers of modules in series. When strings are combined in parallel form, that leads to a scaled current by the number of strings, while voltage equals the individual string’s voltage. A PV system can consist of a single string or multiple strings, depending on the size of the system.
Blocking Diode
Moving to the shading effect on PV systems, similar to the modules level effect, when one module is shaded within the string, the entire string can lose power by the restriction of current flowing through the string. As the modules solution suggested, the bypass diodes will clear the shading effect by bypassing the shaded module. As a result, that will have a voltage drop impact on the total string voltage that may interfere with the other parallel strings within the system, since equivalent array voltage is dictated by the string with the lowest voltage.
Reflection
What about the scenario when we have a row of shading that covers the same number of modules on each string?
ANSWER: In this case, all strings will experience a voltage drop in the same amount, and that will be a better scenario than having one shaded string.
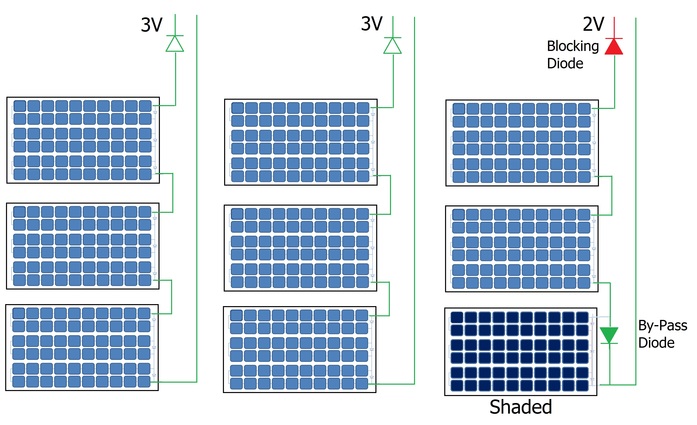
For that reason, some designers choose to add a blocking diode to prevent the current from flowing back to the weak string, and that will eliminate fire hazards as well. Figure 2.6 illustrates the bypass and blocking diodes at the system level and how the total voltage is affected by it. We can see nine PV modules wired to form a PV array. Each group of three modules is connected in series to form a string, for a total of three strings. Each module uses a dedicated bypass diode that only actives when the module is shaded. For example, in Figure 2.6, there is a green colored triangular shape that represents the bypass diode. That is associated with the shaded module illustrated in dark blue in the bottom left corner of Figure 2.6. We can also see red colored triangles that represent the blocking diodes in series with each group to protect the entire string. Assuming each module generates 1V, the unshaded strings generate a total of 3V while the shaded string can only generate 2V (due to the bypass diode effect ). In this case, the blocking diode will protect the shaded string from draining current from the unshaded strings.
Reflection
How does a blocking diode help for PV systems with batteries?
ANSWER: When the sun is not shining, PV modules can act like a load at night. Current can flow back to the PV module so the blocking diode prevents the current from flowing back into the modules and damage it.
Design Recommendations
Finally, as PV designers, we should avoid all types of shading that includes:
- Inter-row shading: as discussed in EME 810 (Lesson 2: Applying Shading to a Solar Chart) [6].
- Soft shading: that can be caused by Trees and moving objects. A solution to that is Tree trimming.
- Hard shading: such as chimneys or pipes, and this should be completely avoided for optimum design.
Review
You may refer to EME 812 (4.4 PV systems across scale) [12] for more information about the cell connections within modules and to visualize how array and strings are formed.
Irradiance and PV Performance Optimization
Performance at PV System Level
Improving module efficiency is only one way to extract more energy from the module. However, what matters ultimately is the energy yield of the PV at the system level. So the question is: What can we do at the system level to increase the yield of PV systems?
Besides the semiconductor material used for PV modules, there are only two parts that play roles in improving the performance of a PV system: electrical and mechanical. The electrical part is responsible for tracking the maximum PowerPoint (MPP), which is a tool to ensure that the PV module operates at the MPP on its I-V curve under a given set of irradiance and temperature. This unit is not something a designer can optimize or change to improve performance during the design phase of a PV system. For those who are not familiar with MPP tracker, you may refer to EME 812 (6.2 Main components of the PV systems) [14] and EME 812 (11.3 DC/DC Conversion) [15].
The other piece is the mechanical part of the PV system that indeed can be optimized by the designer to improve the amount of light falling on a PV array. The simplest way to maximize the solar utility is done by physically changing the orientation and tilt angle of the module, as discussed in EME 810 (Lesson 2: Collector Orientation) [4] and EME 810 (Lesson 6: Project Locale) [17].
As a result, we see the need for tracking the sun using a mechanical tracking system. You may refer to EME 812 (Lesson 3: Tracking Systems) [8] for details about the types and technologies of tracking systems. As the majority of PV systems are fixed mounted, a single choice for orientation and tilt throughout the year changes depending on the geographical location, as discussed in EME 810 (Lesson 6: Project Locale) [17].
Irradiance and PV output
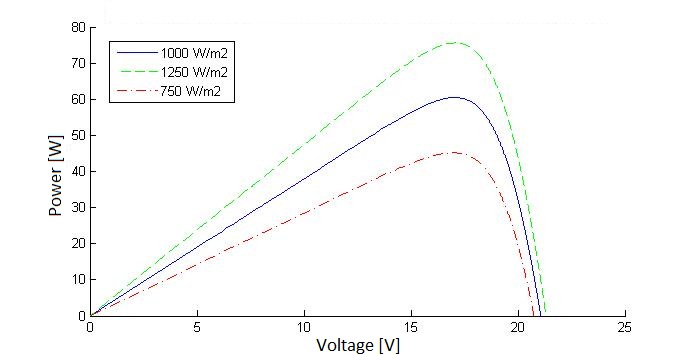
The question remains, how does irradiance affect the PV output? We learned in our review of EME 812 how irradiance and temperature affect the output of a PV cell. A quick recap will tell us that when all parameters are constant, the higher the irradiance, the greater the output current, and as a result, the greater the power generated. Figure 2.7 shows the relationship between the PV module voltage and current at different solar irradiance levels. The image illustrates that as irradiance increases, the module generates higher current on the vertical axis. Similarly, we can observe the voltage and power relationship of a PV module at different irradiance levels. We can see that as irradiance increases, the module is able to generate more power, represented by higher peaks on the curves in Figure 2.8.
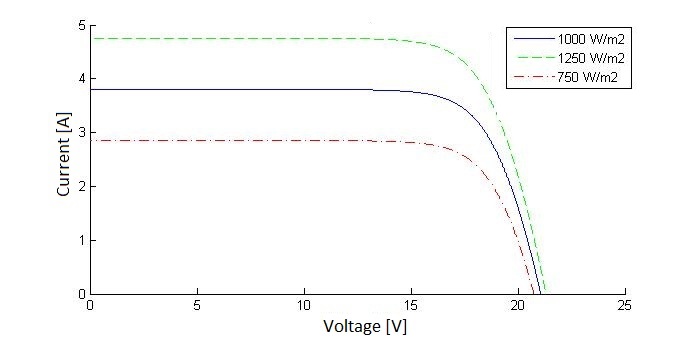
The relationship between irradiance and modules’ current and power can be expressed as the following:;
Where G1 and G2 are the irradiances (in W/m2), I1 and I2 are the modules' corresponding current (in A), and P1 and P2 are the resultant power when irradiance changes (in W).
Tilt and PV Output
The following example illustrates how to find the optimal tilt angle for a fixed mount PV system. If we go to State College, PA and use the chart that was developed in EME 810 (Lesson 2: Sky Dome and Projections) [8] we can see that State College, PA has a latitude around 40.79° in the Northern Hemisphere. In this case, the lowest elevation angle of the sun at solar noontime is around 26° and the highest is around 75°. If we have a tilt tracker, it would vary the range of angles throughout the year between 26° to 75°.
How can we find the tilt corresponding to the maximum yield? This is done using tools developed to calculate the annual energy generation from a PV array given the design tilt and azimuth angles. Some references and designers prefer to set the tilt angle to match the latitude of the selected location as a rule of thumb. However, that does not necessarily maximize the annual energy production of the PV system, as discussed in EME 810 (Lesson 6: Project Locale) [17].
In general, a lower tilt angle helps improve production in the summer months, whereas higher tilt angles favor lower irradiance conditions in the winter months. Designers should take into account the cost of racking and mounting hardware, which can be minimized by lower tilt angle and also minimize the risk of wind damage to the array. So without tedious mathematical calculations, and in order for us to find the optimal tilt and azimuth angles, solar designers can use simple tools developed by NREL. As you were exposed to in Lesson 1, PVWatts is a freely available online design tool and it helps designers calculate the annual energy production using simple parameters to maximize the solar utility for the location.
Going back to State College, PA, and since we have fixed panels oriented towards the South, the optimized tilt angle that will give the maximum energy yield is around 30-35 degrees.
Note:
- For rooftop solar systems, tilt and azimuth usually follow the pitch and orientation of the roof.
- For ground mount systems, not all tilt angles can be provided by the racking structure. For example, if we find optimal tilt for a location to be 34°, but the racking manufacturer has a standard of 30° tilt, designers should take into account the availability of materials and additional cost associated with custom designed racking.
Temperature and PV Performance Optimization
Effect of Temperature on the Module's Behavior
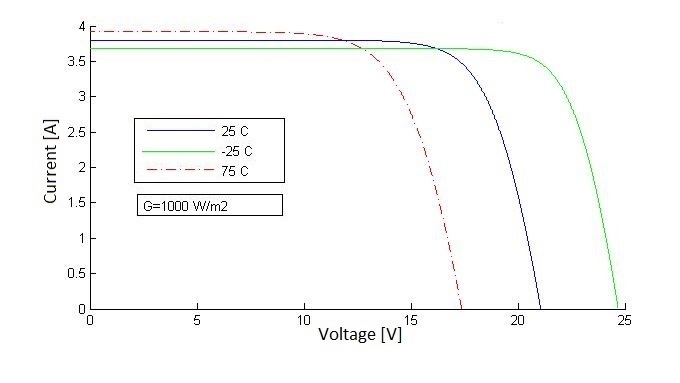
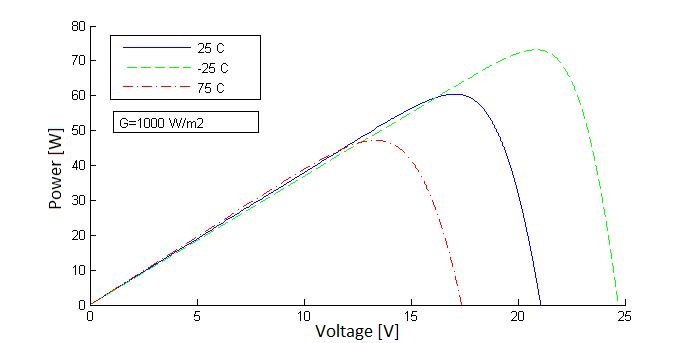
In regard to the temperature, when all parameters are constant, the higher the temperature, the lower the voltage. This is considered a power loss. On the other hand, if the temperature decreases with respect to the original conditions, the PV output shows an increase in voltage and power. Figure 2.9 is a graph showing the relationship between the PV module voltage and current at different solar temperature values. The figure illustrates that as temperature increases, the voltage, on the horizontal axis, decreases. Similarly, the relationship between the PV module voltage and power at different solar irradiance levels is shown in Figure 2.10. We can see that the power decreases as temperature increases, as illustrated by lower power peaks on the curves in Figure 2.10.
Reflection
Why do we see increase in current when the temperature increases, as shown in Figure 2.9?
ANSWER: The small increase in current with temperature can be explained with the fact that carrier concentration and mobility increase in the semiconductor with temperature. In addition, the drop in voltage level can be explained from the basic diode equation [18]. While the temperature affects various terms in the equation, the net effect of temperature is that it decreases the Voc linearly. However, if we check the power values on P-V curves, we can see that a slight increase in current due to increased temperature doesn’t increase the power that much.
The drop in open-circuit voltage with temperature is mainly related to the increase in the leakage current of the photodiode “I0” in the dark with temperature. The “I0” strongly depends on the temperature.
Review
To learn more about the PV performance measure, you can refer to EME 812 (4.3 How PV performance is measured) [11].
The magnitude of voltage reduction varies inversely with Voc. This means that cells with higher Voc are less affected by the temperature than cells with lower Voc, as can be seen when a c-Si based solar cell, with a Voc of 0.65 V, is more affected than the a-Si with a Voc of 0.85 V. If the temperature of the PV module is increased by 10°C, how will the output be affected? The PV module manufacturers specify the temperature coefficients in the datasheets.
Temperature Coefficient
Temperature coefficient is defined as the rate of change of a parameter with respect to the change in temperature. It can be current, voltage, or power temperature coefficient. For example, the temperature coefficient of voltage is the rate of change of the voltage with temperature change. Similarly, temperature coefficient of power is the rate of change of the output power with temperature change. A typical datasheet of a commercial PV module specifies temperature coefficients for the power, Voc, and Isc under STC conditions. (Note: we will discuss the STC test conditions in the next topic).
Temperature coefficient are usually provided by the manufacturers and can be measured in terms of voltage change per degree ( V/°C) or as a percentage per degree change (%/°C).
Given these coefficients, how do we calculate the PV output with respect to the temperature change?
Effect of Temperature Change on Module's Parameters
In order for us to understand the numerical temperature effects on module, we need to define these two simple equations.
The terms Vstc and Pstc refer to the Voltage and Current taken at STC while the temperature coefficients of the voltage is represented by Vt-coeff and Pt-coeff, respectively.
It should be noted that the reference temperature taken for this calculation is the STC temperature (25°C ) as it appears on the equations.
Let's take an example.
If the maximum power output of a PV module under STC is 240 W, and the temperature coefficient of power is -2 W/°C, then the module's power output at a temperature of 30°C can be calculated as follows:
As you can see, the sign of the temperature coefficient determines if the parameter is increasing or decreasing with temperature.
In the previous example, when we said that the temperature was 30°C, did we mean the PV modules temperature or the ambient temperature? Are they equal? The simple answer is that module temperature or the cell temperature can be quite different from the ambient temperature.
Reflection
There could be several factors impacting the heat flow in and out of the modules. What are the factors that impact the heat flow in and out of the module?
ANSWER: One major factor is the cell encapsulation and framing that increase the operating temperature of the PV module. The operating temperature of a module will be a result of the heat exchange between the PV module and the environment. This heat exchange depends on several factors such as ambient temperature, wind speed, heat transfer coefficients between the module and the environment, and the thermal conductivity of the module's body.
Then, how do we estimate the module temperature based on the ambient temperature if we have to account for so many factors? Researchers developed a model provided in literature that gives a reasonable estimate of the module temperature as a function of the ambient temperature. This model is sometimes called the NOCT model, due to the use of the Nominal Operating Cell Temperature. The NOCT is a parameter defined for a particular PV module. NOCT is the temperature attained by the PV cell under an irradiance of 800 W/m², with a nominal wind speed of 1 m/s and an ambient temperature of 20°C.
Here, G is the irradiance at the instant when the ambient temperature is T_ambient. The model gives the corresponding cell temperature as T_cell. As can be seen from this equation, the cell temperature is not only a function of the ambient temperature, but also of the irradiance. This makes things interesting, because if we consider the irradiance and temperature changes over a calendar year, we would see an effect of both irradiance and temperature across the seasons.
Reflection
Is it better to operate PV modules during the summer season or is it better to operate in during the winter season to increase production?
ANSWER: According to what we have just learned, PV modules perform better when the temperature is cooler. In summer, although the sun is shining more, the module is performing worse due to the temperature effects that bring down the PV output at a high cell temperature. In winter, the detrimental temperature effects are far less, although the irradiance levels also fall severely in winter. This means that the best ambient conditions for your PV module would be a cold day with a clear sky.
Temperature and Ideality Factor of PV Modules
So, how serious can temperature affect the performance of PV modules over the year? The difference between the expected PV yield with rated efficiency and the actual yield due to the temperature effect increases the module’s ideality factor, which is nothing but the ratio of the expected PV yield to the actually available, and taking into account the temperature effects.
When the ideality factor of a module is 80%, that means that the module has lost 20% of its annual energy yield due to temperature effects. If the module ideality factor is 100%, that means the module doesn’t change when temperature changes, and that is almost impossible.
Ideality Factor and PV module Type
As a result, we can see that the temperature effect on the module output is a function of the PV technology and the manufacturing process, which collectively decides the temperature coefficients of the PV module. The temperature effect is also a function of the ambient conditions. For the same technology, there could be a deviation in the temperature coefficients due to the manufacturing processes and other design modifications. The a-Si technology shows very low temperature coefficients due to their high open-circuit voltage. This means it shows a better response under high temperatures. However, its efficiency is far lower compared to some of the best c-Si technologies.
According to IEA PV roadmap 2014, c-Si modules have the highest market share compared to other PV technologies such as a-Si. C-Si technologies dominate the global PV market with a share of 90%. In other words, every 9 of 10 PV installation is c-Si modules. If we look closer at the c-Si market, we can see that polycrystalline silicon is the most commonly used technology, according to an EPRI study, with a market share of 60%. This is due to the fact that it is the most efficient in terms of conversion efficiency and economics of scale that make it an affordable solution.
Monocrystalline modules are more area-efficient, but are not the best economical solution. a-Si modules are more affordable, lighter, and sometimes even flexible, but give poorer yield and required more land area.
There is plenty of optimization to be done in order to choose an ideal PV module for your system. The optimum choice will depend on the location, ambient conditions, and of course, taking into account the budget of the client.
Interpreting PV Manufacturer Datasheet
PV modules are the final commercial product that customers buy from manufacturers and that require some data provided from manufacturers to allow customers to evaluate the performance of these modules in terms of electrical power rating, safety, and reliability measures. For that purpose, the module’s performance is set by test standards. These standards vary according to the location where the modules are to be used. For the purpose of our class, we will focus on the US standards -- and some of these standards apply internationally.
Safety
PV modules should be approved/listed by Underwriter Laboratories (UL), which is a nationally recognized test laboratory accepted by OSHA that assures that manufacturers comply with electrical safety standards.
Reflection
What is the UL safety standard that relates to PV modules?
ANSWER: UL 1703 Safety standards for flat-plate photovoltaic modules and panels.
Reliability
PV modules are expected to meet certain quality measures that are set by the international Electrotechnical Commission (IEC). These standards are specific to the technology, e.g., IEC has different standards for Thin-film and Crystalline Silicon.
Reflection
What are the IEC reliability standards that relate to PV Crystalline Silicon modules?
ANSWER: IEC 61215 Safety standards for flat-plate photovoltaic modules and panels.
PV Module Datasheet Parameters
PV module manufacturers are required by NEC and IEC to provide their product with performance information such as the electrical characteristics measures that have to be labeled on nameplates. These parameters include maximum power, open-circuit voltage, short-circuit current, maximum overcurrent device rating, and maximum permissible system voltage. However, these numbers vary according to operating conditions such as temperature and irradiance. For that reason, test standards are needed to set reference operating conditions when taking the measurements at the laboratory.
PV Module and Test Standards
There are various test standards that differ mainly by the operating condition used when taking the measurement. For example, Standard Test Conditions (STC) is an international and most widely used test standard that rates PV modules at solar irradiance of 1000 W/m2, spectral conditions Am1.5, and cell temperature of 25 °C (77 °F). However, in practice, modules rarely operate in these conditions, and that's the main reason behind other test standards that try to simulate real-world operating conditions.
Reflection
What are the other test standards that are used to measure PV performance and how they differ?
ANSWER: The following table shows various standards and the reference values used for each test.
| Name | Abbreviation | Solar Irradiance (W/m2) | Wind Speed (m/s) | Temperature °C (°F) |
|---|---|---|---|---|
| Standard Test Conditions | STC | 1000 | N/A | 25°C Cell Temperature |
| Nominal Operating Conditions | NOC | 800 | N/A | Nominal Operating Cell Temperature (NOCT) |
| Standard Operating Conditions | SOC | 1000 | 1 | Nominal Operating Cell Temperature (NOCT) |
| PVUSA Test Conditions | PTC | 1000 | 1 | 20°C (68°F) ambient Temperature |
So to put everything we have learned so far together, let’s take a look at a PV modules’ datasheet for Trina Solar Allmax 250 W. As can be seen, most module manufacturers have series of modules with different power ratings, and they all appear in the same specification sheet. We can see the main electrical parameters and power ratings at STC and NOCT, efficiency, power tolerance, temperature coefficients, warranty, mechanical dimensions and testing certifications such as UL and ISO and more.
Some considerations when selecting PV modules
Since PV systems are large in size and consist of multiple panels, we expect these systems to be visible to clients, and there will be an aesthetic factor involved in the design process. For example, a client may have a color preference for the PV panels that should be taken into account when selecting the panels, since it might be affected by the availability of that color. Another aesthetic factor is the dimension of each panel and the layout on the roof, for example. A designer should discuss with clients all possible options for best design to maximize the solar utility at that location while keeping the system aesthetically acceptable. Other selection factors are more technical, such as the number of cells in each panel, protection fuses and bypass diodes, degradation, and warranty. All these factors should be taken into account when selecting the right module.
Lesson 2 Activity
| Activity | Details |
|---|---|
| Assignment |
Refer to the scenario on the first page of this lesson. Imagine that, in addition to working in procurement, you are also a solar analyst for this company. You have a client who is willing to invest in a 10kW PV system. The client has three properties in three different cities and he/she is asking for your advice to help choose the right place for the PV system. (Note: the client doesn’t have any preference for the PV modules, installation type, or system orientation. So assume a fixed ground mount with no shading at any of these places). The cities are: Task 2: DeliverablePrepare a report showing both simulation results for SAM and PVWatt. The report is to be no more than one double-spaced page in a 12 point font. Include the following in your report:
|
| Submission Instructions and Grading | Please visit the Lesson Activity [21] page for submission instructions and grading information. |
Procurement Report Part A
This week, you will begin preparing a multi-week Report of the available PV components in the market.
| Activity | Details |
|---|---|
| Assignment | Visit the Procurement Report/Peer Review [22] page for details on the overall assignment. This week, you will be working on Part A. Note: You will not be submitting this part individually. Rather, you will be combining it with Parts B and C for a single Report submission at the end of Lesson 4. In Part A:
|
Summary and Final Tasks
Let's go back to our scenario from the beginning of this lesson. You returned from the solar trade show, where you collected some datasheets for a series of PV modules from different manufacturers. Now that you are fully knowledgeable about the basic information of PV technology types, efficiency, power, voltage and current ratings of modules, you can work on the report needed for your director. In addition, you can confidently recommend the best PV module candidate for the solar firm you work for based on the module efficiency, color, dimensions, test standards and certifications.
As a solar designer, you are equipped with the right tools and software that can be used to learn more about the annual energy production of PV modules and the system at large. These tools help you understand the factors (such as orientation - tilt and azimuth - and ambient temperature) that affect the performance of these PV modules when they are installed. Finally, you can suggest methods to optimize the performance of the PV system.
The next lesson will discuss the bucket of stand-alone PV systems, which is the "Storage System." We will cover a variety of topics, starting from basic characteristics to factors that affect performance. Finally, we will cover the essential parameters and curves that lead to optimal design.
Reminder - Complete all of the Lesson Requirements!
You have reached the end of this lesson. Before you move to the next lesson, double-check the list on the first page of the lesson to make sure you have completed all of the requirements listed there.