
The current market for crude oil is truly global in reach. Oil cargoes move with relative ease between countries and across oceans. While most U.S. oil imports come from a relatively small group of countries, it is misleading to think that only those countries have an impact on oil prices in the United States. Because oil can and does move so freely from one area to another across the globe, it is better to think of the oil market as a global pool, rather than as a network of suppliers and buyers. If one supplier shrinks the overall depth of the pool by withholding supply (or floods the pool by producing a lot of oil), then the impact will be felt uniformly throughout the pool.
At this point, you are encouraged to listen to episodes 1, 2, and 3 of the Planet Money Buys Oil podcast. This podcast is very entertaining and will give you a sense of what the "physical" market for crude oil is like. The physical market is what we've been talking about so far in this lesson - the part of the oil market where buyers and sellers exchange money for crude oil. In the next part of the lesson, we'll move into the "futures market" for crude oil, which is where all sorts of different market players hedge and speculate on the physical price of crude oil. Episode 3 gets into the refining area which we are also covering here.
The pricing of oil is determined largely by a mix of fundamental supply and demand factors, as well as expectations. How much of any given oil-price movement is due to each of these three factors is an eternal mystery that keeps a small army of editorial columnists and television talking heads in business. The supply-demand balance is perhaps the easiest piece to explain - when demand is high (for example, during the wintertime when heating oil demands are high or during the summer when people tend to drive more often and further distances), consumers are willing to pay more for refined petroleum products, and higher-cost oil supplies must be brought online. Thus, the price goes up. Similarly, when accidents, political strife, or war keep supplies offline, higher-cost replacements must be found, and the price goes up. Expectations can play a large role in pricing outcomes in the oil (as well as gas and refined products) markets. The role of people’s expectations can be traced back to OPEC's successes in the 1970s in increasing world oil prices, even for brief periods. Believing that OPEC had the power to do pretty much whatever it wanted, market participants began engaging in a series of self-fulfilling prophecy games. They worked something like this. First, one or more market participants would believe that OPEC would act to increase prices or reduce supply. Afraid of getting caught short or unable to fulfill contracts, stockpiling commenced, pushing up spot prices. Thus, all OPEC needed to do was cause panic in the markets by spreading rumors of policy changes. The gains were nearly always short-lived as the high cost of inventories would result in sell-offs, bringing oil prices down to pre-panic levels. Nowadays, broader geopolitical concerns, particularly in the Middle East, Africa, and Russia/Ukraine, have replaced the grumblings of OPEC as the source for expectations-induced spikes in fossil fuel prices including natural gas.
OPEC was mentioned earlier as an entity that has been able to exert substantial influence on global markets for crude oil. OPEC operates as a cartel - a group of producing countries that attempt to coordinate supply decisions in order to exert some influence on prices. OPEC does not try to set prices directly, as is often believed. What OPEC countries try to do is to expand or contract oil production in order to keep the world price within some band that the countries collectively deem desirable.
OPEC's actual ability to manipulate oil prices is not all that clear, and its influence has dwindled as more "unconventional" petroleum resources have been developed, including the oil sands in Canada and shale oil in the United States. Most cartels are difficult to sustain since each member of the cartel has the incentive to cheat - in OPEC's case, this means that countries have often produced more oil than they were supposed to under the quota system, as shown in Figure 10.2 (the most consistent cheater seems to have been the country of Algeria). Even during the 1973 embargo, none of the OPEC nations approached the formal 5% production cut mentioned in the embargo. Saudi Arabia's production decreased by 0.8%. Iraq and Oman saw the biggest percentage cuts in production at 1%. Prices did indeed go up, but largely as a result of fear and higher taxes rather than actual supply shortages. The actual production cuts lasted only three weeks; the embargo fell apart in December when Saudi Arabia raised production.
NOTES:
- Roll your mouse over the name of a country to highlight the plotted line for that country.
- Roll your mouse over the plotted lines to reveal data values.
- Click on country names to hide or reveal the data from the graph.
| Algeria | Indonesia | Iran | Libya | Nigeria | Qatar | Saudi Arabia | UAE | Venezuela | |
|---|---|---|---|---|---|---|---|---|---|
| 1982 Jan | 53 | -3 | 110 | 67 | -8 | 0 | -21 | 18 | 27 |
| 1982 Mar | 49 | 0 | 81 | 50 | -5 | 6 | -15 | 15 | 22 |
| 1982 Jun | 46 | 3 | 52 | 34 | -2 | 11 | -10 | 12 | 17 |
| 1982 Sep | 42 | 6 | 24 | 18 | 1 | 16 | -4 | 9 | 12 |
| 1983 Jan | 39 | 10 | -5 | 2 | 4 | 21 | 1 | 6 | 7 |
| 1983 Mar | 41 | 10 | -5 | 2 | 6 | 19 | 0 | 10 | 8 |
| 1983 Jun | 43 | 11 | -5 | 3 | 8 | 17 | -2 | 15 | 8 |
| 1983 Sep | 45 | 12 | -5 | 4 | 10 | 15 | -4 | 19 | 9 |
| 1984 Jan | 46 | 13 | -5 | 4 | 12 | 14 | -5 | 23 | 10 |
| 1984 Mar | 48 | 13 | -5 | 5 | 14 | 12 | -7 | 28 | 10 |
| 1984 Jun | 50 | 14 | -5 | 5 | 15 | 10 | -8 | 32 | 11 |
| 1984 Sep | 50 | 14 | -5 | 5 | 15 | 10 | -8 | 32 | 11 |
| 1985 Jan | 50 | 14 | -6 | 5 | 15 | 9 | -8 | 32 | 11 |
| 1985 Mar | 49 | 14 | -6 | 5 | 15 | 8 | -8 | 32 | 11 |
| 1985 Jun | 49 | 14 | -6 | 5 | 15 | 7 | -7 | 32 | 11 |
| 1985 Sep | 49 | 14 | -6 | 5 | 15 | 7 | -7 | 32 | 10 |
| 1986 Jan | 49 | 14 | -7 | 5 | 15 | 6 | -7 | 32 | 10 |
| 1986 Mar | 48 | 14 | -7 | 5 | 15 | 5 | -7 | 32 | 10 |
| 1986 Jun | 48 | 13 | -7 | 5 | 15 | 4 | -6 | 32 | 10 |
| 1986 Sep | 59 | 16 | 6 | -4 | 4 | 2 | -1 | 35 | 16 |
| 1987 Jan | 61 | 16 | 0 | -1 | 6 | -25 | 2 | 62 | 15 |
| 1987 Mar | 63 | 16 | -6 | 3 | 8 | -53 | 4 | 88 | 13 |
| 1987 Jun | 59 | 14 | -5 | 10 | 10 | -18 | 9 | 75 | 16 |
| 1987 Sep | 56 | 13 | -5 | 18 | 12 | 17 | 13 | 62 | 19 |
| 1988 Jan | 56 | 13 | -2 | 16 | 13 | 16 | 13 | 63 | 18 |
| 1988 Mar | 56 | 13 | 0 | 13 | 15 | 15 | 13 | 65 | 18 |
| 1988 Jun | 56 | 13 | 3 | 11 | 17 | 14 | 13 | 67 | 16 |
| 1988 Sep | 56 | 13 | 6 | 9 | 19 | 13 | 13 | 69 | 16 |
| 1989 Jan | 53 | 10 | -47 | 7 | 23 | 16 | 8 | 74 | 13 |
| 1989 Mar | 50 | 7 | -99 | 6 | 27 | 19 | 3 | 78 | 10 |
| 1989 Jun | 43 | 4 | -3 | 3 | 20 | 12 | 8 | 95 | 8 |
| 1989 Sep | 40 | 1 | -5 | 4 | 8 | 7 | 5 | 90 | 4 |
| 1990 Jan | 43 | 8 | -1 | 13 | 13 | 8 | 22 | 70 | 11 |
| 1990 Mar | 46 | 14 | 3 | 21 | 18 | 9 | 38 | 50 | 17 |
| 1990 Jun | 47 | 13 | 3 | 15 | 13 | 7 | 25 | 34 | 13 |
| 1990 Sep | 48 | 12 | 3 | 9 | 8 | 5 | 12 | 18 | 9 |
| 1991 Jan | 49 | 12 | 3 | 3 | 3 | 3 | -2 | 2 | 5 |
| 1991 Mar | 53 | 12 | 4 | 2 | 6 | 1 | 0 | 3 | 6 |
| 1991 Jun | 56 | 13 | 5 | 1 | 9 | 0 | 1 | 4 | 6 |
| 1991 Sep | 60 | 14 | 6 | 6 | 12 | -1 | 3 | 4 | 6 |
| 1992 Jan | 60 | 14 | 6 | 5 | 12 | 4 | 3 | 4 | 6 |
| 1992 Mar | 59 | 14 | 6 | 4 | 13 | 9 | 2 | 3 | 5 |
| 1992 Jun | 59 | 14 | 6 | 4 | 13 | 13 | 2 | 2 | 4 |
| 1992 Sep | 58 | 13 | 6 | 3 | 14 | 18 | 1 | 1 | 4 |
| 1993 Jan | 63 | 16 | 9 | 0 | 12 | 14 | 3 | 2 | 9 |
| 1993 Mar | 61 | 15 | 6 | 0 | 9 | 15 | 3 | 2 | 11 |
| 1993 Jun | 60 | 13 | 3 | -1 | 6 | 16 | 3 | 3 | 13 |
| 1993 Sep | 60 | 14 | 3 | 0 | 7 | 20 | 3 | 3 | 15 |
| 1994 Jan | 61 | 14 | 3 | 0 | 8 | 23 | 3 | 3 | 17 |
| 1994 Mar | 62 | 14 | 3 | 0 | 9 | 27 | 3 | 4 | 19 |
| 1994 Jun | 63 | 14 | 3 | 1 | 11 | 31 | 3 | 4 | 21 |
| 1994 Sep | 64 | 14 | 3 | 1 | 12 | 35 | 4 | 5 | 23 |
| 1995 Jan | 65 | 15 | 3 | 1 | 13 | 38 | 4 | 5 | 25 |
| 1995 Mar | 66 | 15 | 3 | 1 | 14 | 42 | 4 | 5 | 27 |
| 1995 Jun | 67 | 15 | 3 | 2 | 16 | 46 | 4 | 6 | 29 |
| 1995 Sep | 67 | 15 | 3 | 2 | 17 | 50 | 5 | 6 | 31 |
| 1996 Jan | 68 | 15 | 3 | 2 | 18 | 53 | 5 | 7 | 33 |
| 1996 Mar | 69 | 15 | 3 | 3 | 19 | 57 | 5 | 7 | 35 |
| 1996 Jun | 65 | 14 | 1 | 2 | 18 | 60 | 5 | 6 | 35 |
| 1996 Sep | 60 | 12 | -1 | 1 | 17 | 62 | 4 | 5 | 35 |
| 1997 Jan | 56 | 10 | -3 | 0 | 16 | 65 | 4 | 4 | 34 |
| 1997 Mar | 51 | 9 | -4 | -1 | 15 | 68 | 4 | 3 | 34 |
| 1997 Jun | 47 | 7 | -6 | -2 | 13 | 70 | 4 | 2 | 34 |
| 1997 Sep | 42 | 5 | -8 | -3 | 12 | 73 | 3 | 1 | 33 |
| 1998 Jan | 55 | 19 | 10 | 4 | 1 | 2 | 2 | 7 | 6 |
| 1998 Mar | 46 | 10 | 1 | -4 | 16 | 86 | 1 | 8 | 38 |
| 1998 Jun | 52 | 14 | 3 | 0 | 15 | 62 | 2 | 8 | 26 |
| 1998 Sep | 57 | 18 | 6 | 4 | 13 | 37 | 3 | 8 | 14 |
| 1999 Jan | 63 | 22 | 8 | 8 | 12 | 13 | 4 | 8 | 3 |
| 1999 Mar | 61 | 19 | 8 | 7 | 36 | 13 | 4 | 9 | 2 |
| 1999 Jun | 60 | 17 | 9 | 7 | 59 | 13 | 3 | 9 | 1 |
| 1999 Sep | 59 | 14 | 9 | 7 | 82 | 12 | 2 | 10 | 2 |
| 2000 Jan | 57 | 12 | 9 | 6 | 106 | 12 | 1 | 10 | 1 |
| 2000 Mar | 56 | 10 | -63 | 5 | 96 | 13 | 3 | 6 | 3 |
| 2000 Jun | 50 | 3 | -3 | 1 | 3 | 10 | 3 | 4 | -3 |
| 2000 Sep | 55 | 9 | 3 | 4 | 10 | 15 | 4 | 9 | 6 |
| 2001 Jan | 63 | 9 | 0 | 6 | 10 | 16 | 4 | 10 | 4 |
| 2001 Mar | 65 | 10 | 3 | 6 | 16 | 15 | 4 | 8 | 4 |
| 2001 Jun | 67 | 12 | 5 | 6 | 23 | 15 | 4 | 6 | 4 |
| 2001 Sep | 86 | 13 | 8 | 13 | 21 | 21 | 8 | 10 | 5 |
| 2002 Jan | 76 | 7 | -10 | 13 | 19 | 21 | 10 | 8 | -15 |
| 2002 Mar | 67 | 2 | -28 | 13 | 17 | 21 | 12 | 7 | -36 |
| 2002 Jun | 57 | -4 | -46 | 12 | 15 | 22 | 13 | 6 | -56 |
| 2002 Sep | 47 | -9 | -62 | 12 | 13 | 22 | 15 | 4 | -76 |
| 2003 Jan | 38 | -16 | 1 | 7 | -3 | 17 | 15 | 4 | -33 |
While OPEC has been viewed historically as a cartel that keeps oil prices high, its members have, more recently, probably been at least partially responsible for the rapid decline in oil prices. The Economist has a nice and recent article describing the factors that have been contributing to the slide in oil prices. This has been partly due to sluggish economies in developing countries, energy efficiency in rich countries, the boom in shale-oil production in the United States (which we will come back to in a few weeks), and a strategic decision by Saudi Arabia to maintain high oil production levels even in the face of low prices (this is perhaps an attempt to inflict economic pain on the shale-oil business in the U.S.).
Earlier, it was discussed that when demand increases, higher-cost supplies must be brought online to meet that higher demand. Prices for oil have certainly been on a roller-coaster ride over the past few years. Does this mean that a few years ago, we thought all of the cheap oil in the world was gone, but we have now discovered new supplies of cheap oil? And if not, then what explains the price movements that we have seen in the oil market in recent years?
The answer depends on some understanding of the cost of supplying crude oil. Figure 10.3 provides a rough idea of the cost of extracting different types of oil resources. The low-cost resources are conventional oil fields that have been operating for decades. The higher-cost resources are so-called "unconventional" sources of oil, including deepwater or Arctic drilling; the oil sands of Alberta, Canada; and extraction of oil from shale formations (one of the best-known examples is the Bakken shale in North Dakota, whose extraction costs are somewhere in the lower end of the range shown - perhaps around $50 to $60 per barrel). If the producers of conventional oil were to flood the market, then the price would drop so low that unconventional players would be forced to shut down. This would be good for consumers right now, but bad for the producers of conventional oil (and eventually for consumers), since there would be less oil to sell later on. Thus, conventional oil producers hold some output back, leaving the unconventional producers to serve the leftover or "marginal" demand. This is good for conventional oil producers in both the short and long term (because they earn larger profits), but is bad for consumers in the short term. (In the long term, this strategy keeps prices from rising to even higher levels in the future.)
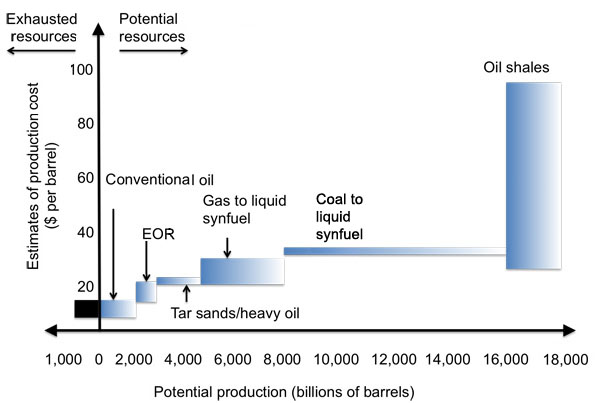
| Energy Source | Potential Production (billion barrels) | Production Cost ($ per barrel) |
|---|---|---|
| Conventional Oil | 2000 | 10-15 |
| EOR | 2000-3000 | 15-20 |
| Tar Sands/Heavy Oil | 3000-5000 | 20-22 |
| Gas to liquid synfuel | 5000-8000 | 20-30 |
| Coal to liquid synfuel | 8000-16000 | 32-34 |
| Oil Shales | 16000-18000 | 30-90 |
Part of the reason that crude-oil prices have been so high for so long is the increased role that unconventional oil is playing in world oil supply. This is due in some part to the natural decline in output that is expected from conventional oil fields as they mature (more on this later when we talk about "peak oil"). The growth in unconventional oil supplies has been so rapid that countries with large reserves of unconventional oil, such as the United States, have become large oil producers in a very short period of time.