
Basic Drivers of Natural Gas Demand
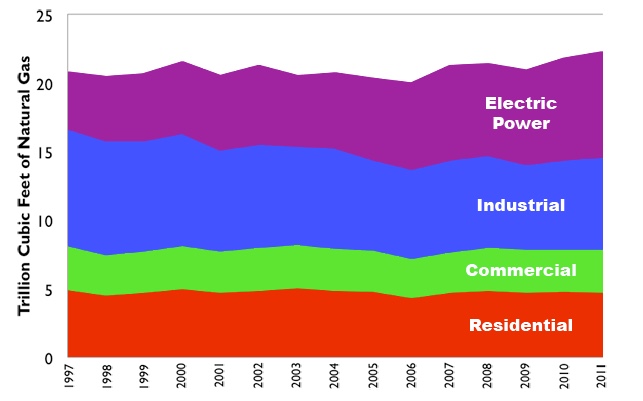
Natural gas is used in industrial, commercial, residential, and electric power applications. Natural gas demand in the United States has remained virtually flat for the better part of a decade, although, as shown in Figure 10.14, there has been a shift in the composition of that demand, away from industrial utilization and towards the electric power sector. Expectations are that the emergence of low-priced gas supplies from unconventional sources will change the drivers of natural gas in two ways – first, demand among both the industrial and electric power sector is anticipated to increase. Second, surplus natural gas supplies may open up an entirely new export sector for North American natural gas.
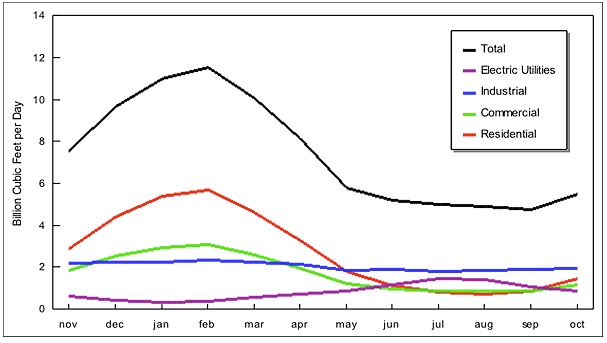
Each demand sector has its own intra-annual pattern of natural gas demand. Residential demand, for example, tends to be highest in the winter (because of demand for space heating), while demand in the electric power sector tends to be highest in the summer, due to higher demand for electricity (for air conditioning). Overall, natural gas demand in the United States peaks in the wintertime, with a lesser peak during the summer. A typical set of annual demand profiles is shown in Figure 10.15. There are some shifts occurring here as well, particularly as demand from the electric power sector continues to climb.
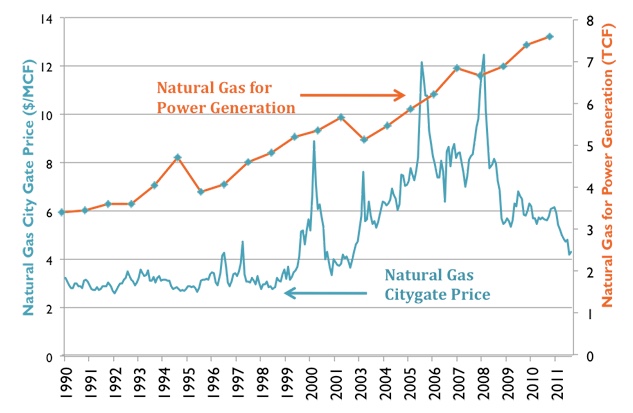
Beginning in the mid to late 1990s, the U.S. electric power sector started undergoing a transformation away from building new coal-fired power plants and towards building new natural gas plants. This shift took place for a variety of reasons, including increasingly stringent environmental requirements for power plants and a shift in the market for electricity induced by deregulation and restructuring. This shift towards more gas-fired power generation was associated with a pronounced increase in both the average spot price of natural gas and the volatility of natural gas prices, as shown in Figure 10.16. This association seems to have broken down since 2009 – there has been additional investment in, and utilization of, gas-fired power generation but a pronounced decline in natural gas prices. This trend reflects the influence of additional gas supplies from unconventional deposits (primarily shales and tight sandstone formations) coming online. Referencing our discussion of capacity constraints in the lesson on petroleum refining, the price and utilization trends in Figure 10.16 reflect textbook energy economics – the build-out in natural gas generation represented increased demand without a corresponding increase in natural gas supply, pushing the global demand curve towards the capacity constraint and rapidly increasing prices (some price spikes such as those observed in 2000, 2005, and 2008 are associated with extreme weather events like hurricanes or interruptions to gas pipeline networks, such as an explosion in the Western U.S. in 2000).
Credit: Energy Information Administration data