
Futures contracts for refined petroleum products
Gasoline, diesel fuel, and heating oil are volatile commodities – prices fluctuate up and down, sometimes dramatically, as shown in Figure 10.10 which compares spot prices for crude oil with retail prices (i.e., what you would pay at the pump) for gasoline and diesel fuel. Focusing on gasoline and diesel fuel, you will notice that there is some pattern to all of the noisiness in the graphic – prices for both fuels tend to rise starting in the spring and tend to decline in the late summer and fall. This reflects the increased demand for transportation (primarily driving) during the summer months.
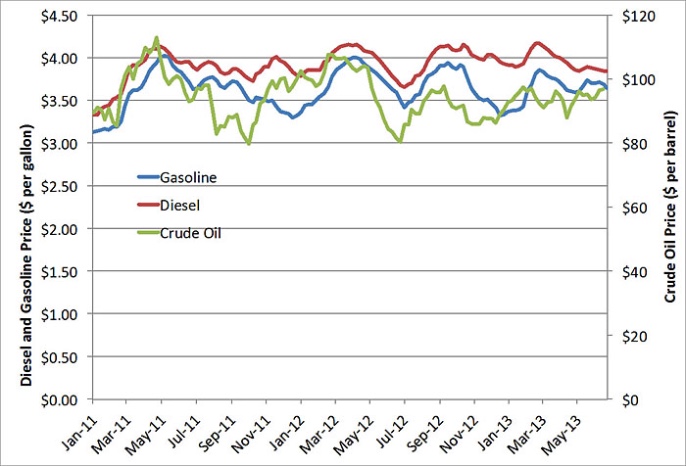
Why are prices for petroleum products so volatile? The easy (but not that satisfying) answer is that the price of crude oil can be volatile. In the United States, about 65 cents of every dollar we pay for diesel fuel or gasoline represents the cost of crude oil. The rest represents taxes assessed at the state and federal level. (In European countries, taxes are a much bigger component of gasoline costs.) You can see the volatility visually through the use of the crude oil price graphing tool from the U.S. Energy Information Administration. It allows you to plot the price of West Texas Intermediate (the benchmark crude oil price in the U.S.) on a daily, monthly, and annual basis (depending on how much variability you want to see).
Starting in early 2008, prices climbed very rapidly, reaching nearly $150 per barrel in early July. But by December of that year, the price had dropped by almost 75%! Meanwhile, more recently, the price has dropped to $40 per barrel or even lower! What on earth is going on?
That supply and demand forces were at work is the primary reason, but the nature of the supply and demand forces are worth some time discussing. Suppose that the demand for crude oil or a refined petroleum product were to increase by some amount. How would that demand be met? There are basically two options: existing idle capacity (oil wells or petroleum refineries, for example) could be restarted, or that demand could be met by drawing down crude oil or petroleum product storage. If additional capacity could be restarted, the increase in demand would lead to an increase in the market price due to the higher costs of the capacity brought back online.
But what is the cost of releasing additional supply from storage? Here, we have a tricky economics problem – the actual cost (in accounting terms) of releasing additional supply is probably pretty small. But if you are the owner of some crude oil or petroleum products in storage, if you release supply from storage now, then you can’t release those same barrels again at some point in the future unless you replenish your storage facility (which requires buying oil or petroleum products on the open market and then putting them in storage). So, by releasing from storage now, you are giving up the opportunity for some future profit. This is referred to as “opportunity cost.” (Another term used in the finance field is the “convenience yield.”) Whether the opportunity cost is high or low depends on your expectations about the future price in the crude oil or petroleum products market. If you think demand is going to continue to be high tomorrow, then you face a high opportunity cost by releasing supply from your storage today. If you think that the increase in demand is transient, then that opportunity cost is low (because you think that demand is going to go back down tomorrow).
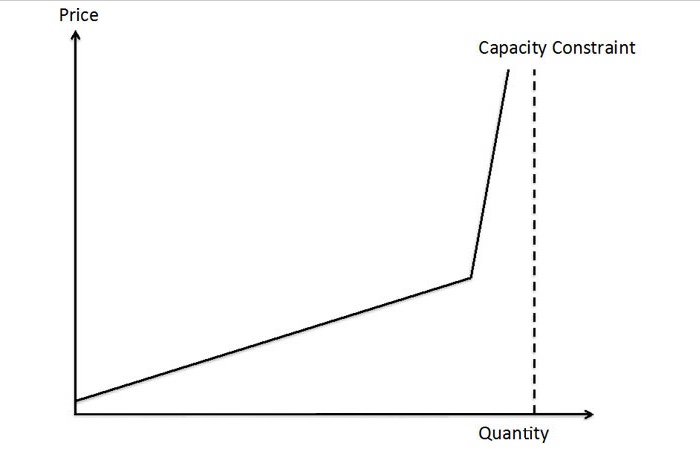
As it turns out, the opportunity cost of releasing supply from storage is related to the amount of spare production capacity, as shown in Figure 10.11. Generally, as the demand for oil or refined petroleum products rises, more expensive capacity (whether it’s oil wells or refineries) must be brought online, so the market price rises as demand goes up. As you get close to the total capacity constraint (the dashed vertical line in the figure), there is literally no more capacity to be brought online, so the price must rise rapidly in order for one of three things to happen: (i) additional supply is released from storage; (ii) new capacity can be constructed, which of course is expensive; or (iii) demand can go down because the price is too high. This transition from a slow and steady price increase to a regime of substantial volatility is endemic to the market for nearly every energy commodity, and the kink in the supply curve shown in Figure 10.11 is appropriately known as the “devil’s elbow” in the energy commodity business.
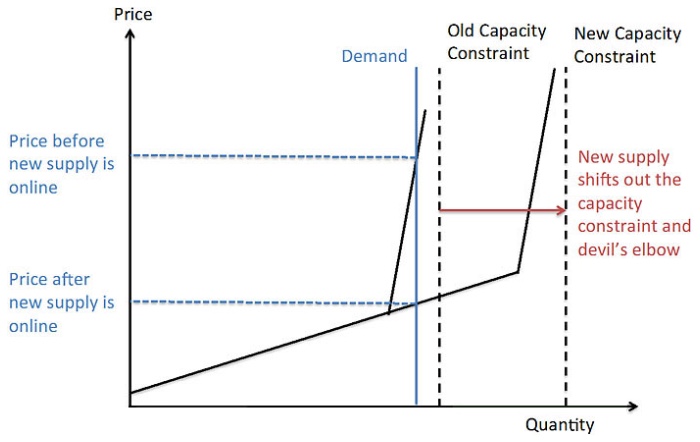
Bringing on new capacity will eventually lead to lower prices if demand stays constant – all it does is to shift the capacity constraint and the devil’s elbow in Figure 10.11 further to the right (this is shown in Figure 10.12). But this may have a self-reinforcing effect of keeping new capacity out of the market. Since new capacity in the refining business is generally built in large chunks (so-called “lumpy” investment – no one is going to build a refinery that processes a few marginal barrels of oil per day), if a new refinery is built without an increase in demand for petroleum products, the net effect may be to reduce the price for petroleum products so much that the new refinery is not profitable. Because of the devil’s elbow and the lumpy nature of bringing new sources online, energy commodity markets generally do not have a stable equilibrium like you might find in economics textbooks.
NYMEX (now called the "CME Group") offers futures contracts for several refined petroleum products - the most frequently-traded are heating oil and gasoline. The video below shows you where to find these prices on the CME Group website.
Video: Refined Product Futures (2:34)
In this video, I'm going to show you where to find information on futures markets for refined petroleum products from the CME Group. So again, we'll start at the CME Group website and we'll click on "Markets." We'll click on "Energy." And then we'll click on "Products." And this will take us down to all of their different energy commodity futures markets. So the two that I'm going to show you are the heating oil futures contract, which says "New York Harbor ultra low sulfur diesel," and the gasoline futures contract, which, here, says "RBOB," which stands for "Refiner Blend on Board." So I'll click on the gasoline one first. And again, we have to wait a minute for information to pop up. And you'll see very similar information about prices and trading volumes that you saw for the crude oil contracts. So we have the month of delivery, we have the last traded price, and the change in the price. And here for the gasoline contract, you'll note that the prices are in dollars per gallon, note dollars per barrel, which is why the numbers look a lot different. And then you'll have the prior subtle for the gasoline contract, the opening high and low prices for the day, and the volume of contracts traded. So that was the gasoline futures contract. I'll now show you where to find the heating oil contract, which is the "New York Harbor ultra low sulfur diesel." And so we'll click on that one. And again, the same kind of information shows up. Now the prices here, like the gasoline contract, are in dollars per gallon. So for the September 2020 contract, this is 1 dollar and 24.31 cents per gallon, not per barrel like in the crude oil contract. So this is how we have used the CME Group website to find information on two of the most commonly traded refined petroleum product markets, heating oil and gasoline.