Evolution and structure of natural gas markets
Please read Chapter 5 of the van Vactor reading (Flipping the Switch: The Transformation of Energy Markets), along with the two RBN Energy articles (Henry the Hub, I am I am and The Way She Moves), before you proceed with the written material here. Sections 5.3 to 5.5 of the van Vactor reading are particularly important.
The North American natural gas market is structured based on what has been called the “hub” model of gas pricing. In markets with hub pricing, the interaction of supply and demand sets prices at a small number of specific locations. These locations are the "hubs." (In the van Vactor reading and in one of the assignment questions for this week, there is some discussion about the properties of a good "hub" trading point.) The "local" price at any other location or points of consumption in the commodity network is thus the hub price plus the cost of transportation from the hub. Price differences between any two points in the gas pipeline network represent just the cost of transportation between those two points.
We can also describe this using some terminology from the natural gas industry (this terminology is also commonplace in the oil industry). If the hub represents some point where it is easy to obtain natural gas without much transportation, this would be referred to as the wellhead price. The point where the natural gas enters the distribution system for local delivery (see Figure 5.1 from the van Vactor reading) is known as the citygate. The citygate price should generally be higher than the wellhead price because of the transportation cost associated with moving the gas from the wellhead to the citygate. The wellhead price simply represents the market equilibrium for the natural gas commodity, not including any transportation costs.
One implication of the hub pricing model is that the entire gas market should roughly obey the law of one price, which says that if the gas market is working efficiently, then price differences should reflect transportation costs. A change in the wellhead price of natural gas would be reflected everywhere else in the network.
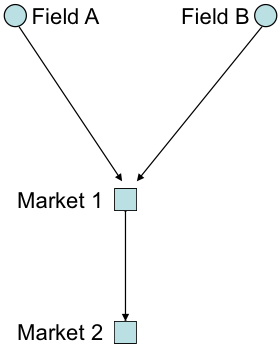
Here is a simple illustration of the law of one price, using the small network shown in Figure 10.17. In this example, p represents the price at a given location and c represents the transportation cost to get from the supply point (wellhead) to a specific location. Gas fields A and B are connected via pipeline to market centers (you can think of these as citygates) 1 and 2. A and B can deliver to both markets, but the transportation cost c is higher to get to market 2 than market 1. Thus, c1 < c2 and in equilibrium, p1 < p2. Thus, gas at Market 1 will be cheaper than gas at Market 2.
Further, in equilibrium p2 = p1 + (c2 – c1), which in words says that the price at Market 2 would be equal to the price at Market 1 plus the transportation cost to Market 2 from Market 1 (the transportation cost to Market 1 from the wellhead is already reflected in the price at Market 1). Using number, suppose that the price of natural gas at the wellhead (either field A or B) was $5 per million BTU ($/MMBTU). The transportation cost to market 1 is $1/MMBTU and the transportation cost to market 2 is $3/MMBTU. If this gas market obeyed the law of one price, then the citygate price at market 1 would be $5/MMBTU + $1/MMBTU = $6/MMBTU. The citygate price at market 2 would thus be $6/MMBTU + ($3/MMBTU - $1/MMBTU) = $8/MMBTU.
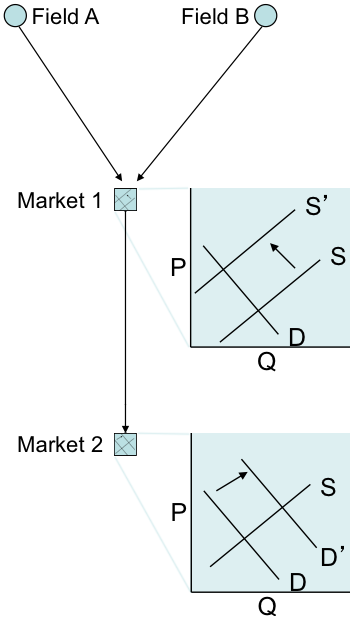
One implication of the law of one price is that changes in supply or demand at one location can affect pricing at all locations in the network. Here is another example, again using the same network (see Figure 10.18). Suppose that demand in market 2 were to increase. Suppliers in both fields would increase their offer prices so that p2 > p1 + (c2 – c1). Assuming that there are no constraints on the size of the pipeline, that increased demand at market 2 would bid up the price for all market points in the network, since all suppliers would try to move their gas to market 2. (Of course, there is some limit to this redirection of supply, since demand in market 2 is finite.) Supply to market 1 would decrease, raising prices in market 1 to restore equilibrium (where the price difference between markets is equal to the difference in transport costs).
It is possible for markets connected by pipelines to depart from the law of one price. The simplest example of how this might happen is if there is a constraint or an interruption on a pipeline. For example, suppose that the pipeline between markets 1 and 2 were to be removed from service, isolating market 2. What would happen to prices at market 1? Market 2? In the assignment for this lesson, you will get some practice looking at the law of one price in the North American natural gas market using data from the U.S. Energy Information Administration.
Every natural gas field within some geographic area has the potential to be a hub pricing point. Locations that are close to producing areas and are also connected to a large number of gas transmission pipelines also have the potential to be good hub pricing points. In general, hub pricing points need to be highly connected to the rest of the network – it should be easy to move gas from the hub point to any other location in the network.
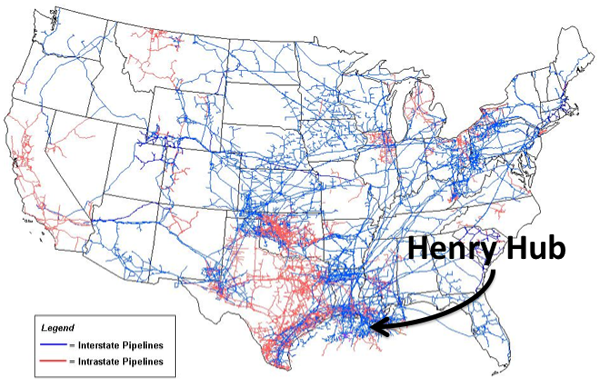
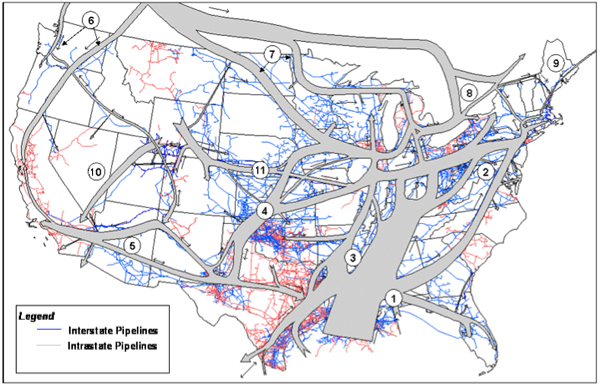
The major hub pricing point in North America is the “Henry Hub,” which is a physical location in Louisiana, indicated in Figure 10.19. Henry Hub is well-connected to the rest of the North American market (as indicated by the flows of gas through North America as shown graphically in Figure 10.20).
The Henry Hub is also the point at which the NYMEX futures contracts for natural gas are priced. The following video shows how to access natural gas pricing data from EIA and NYMEX.
Video: Natural Gas Futures (1:55)
In this video, I'm going to show you how to find natural gas futures price information on the CME Group website. The process is going to be similar to how we found futures price information for crude oil and refined petroleum products. But natural gas is just in a little bit different place. So we're going to start from the CME Group homepage and we're gonna go to markets, and then we're gonna go to energy. Then when the page loads, we're gonna go to products. And then last time, for the crude oil futures information, we had used the crude and refine section. Now we're going to scroll down and go to the Natural Gas section. And what we want here are the Henry Hub natural gas futures. So remember that the Henry Hub is the location where all natural gas futures contracts in North America are treated. So we're gonna click on Henry Hub. And it's going to bring us to the futures price information page, which is going to look similar to what we saw for other futures contracts for crude oil and refined petroleum products. So we're going to have the month for delivery. We're going to have the last recorded price. And here, the prices are in dollars per million BTUs of natural gas. So this is a very different price unit than we saw for oil or refined petroleum products. And then we have the the prior settle column, which is the last traded price that was recorded. And then we have the open opening price, the high and low price for the day for each particular contract, and the number of contracts traded.