
2.1 Available Solar Radiation and How It Is Measured
Before talking about concentration of light for practical purposes, it would be good for us to review what kinds of natural radiation are available to us and how that radiation is characterized and measured.
Solar Constant
The fraction of the energy flux emitted by the sun and intercepted by the earth is characterized by the solar constant. The solar constant is defined as essentially the measure of the solar energy flux density perpendicular to the ray direction per unit area per unit of time. It is most precisely measured by satellites outside the earth atmosphere. The solar constant is currently estimated at 1361 W/m2 [cited from Kopp and Lean, 2011]. This number actually varies by 3% because the orbit of the earth is elliptical, and the distance from the sun varies over the course of the year. Some small variation of the solar constant is also possible due to changes in Sun's luminosity. This measured value includes all types of radiation, a substantial fraction of which is lost as the light passes through the atmosphere [IPS - Radio and Space Services].
Solar Constant (Extraterrestrial solar flux intercepted by the Earth) = 1361 W/m2
Transformations in the Atmosphere
As the solar radiation passes through the atmosphere, it gets absorbed, scattered, reflected, or transmitted. All these processes result in reduction of the energy flux density. Actually, the solar flux density is reduced by about 30% compared to extraterrestrial radiation flux on a sunny day and is reduced by as much as 90% on a cloudy day. The following main losses should be noted:
- absorbed by particles and molecules in the atmosphere - 10-30%
- reflected and scattered back to space - 2-11%
- scattered to earth (direct radiation becomes diffuse) - 5-26% [Stine and Harrigan, 1986]
As a result, the direct radiation reaching the earth surface (or a device installed on the earth surface) never exceeds 83% of the original extraterrestrial energy flux. This radiation that comes directly from the solar disk is defined as beam radiation. The scattered and reflected radiation that is sent to the earth surface from all directions (reflected from other bodies, molecules, particles, droplets, etc.) is defined as diffuse radiation. The sum of the beam and diffuse components is defined as total (or global) radiation.
It is important for us to differentiate between the beam radiation and diffuse radiation when talking about solar concentration in this lesson, because the beam radiation can be concentrated, while the diffuse radiation, in many cases, cannot. For that matter, the solar systems utilizing concentrating collectors will work best in sunny locations and may be not feasible in those with a lot of weather variability and clouds.
Only beam component of solar radiation can be effectively concentrated
Solar Radiation Metrics
Consider the following metrics commonly used to report the solar resource (irradiance) data. These values can be determined from the field measurements or from empirical correlations.
| Metric | Definition | Data Source | Tool |
|---|---|---|---|
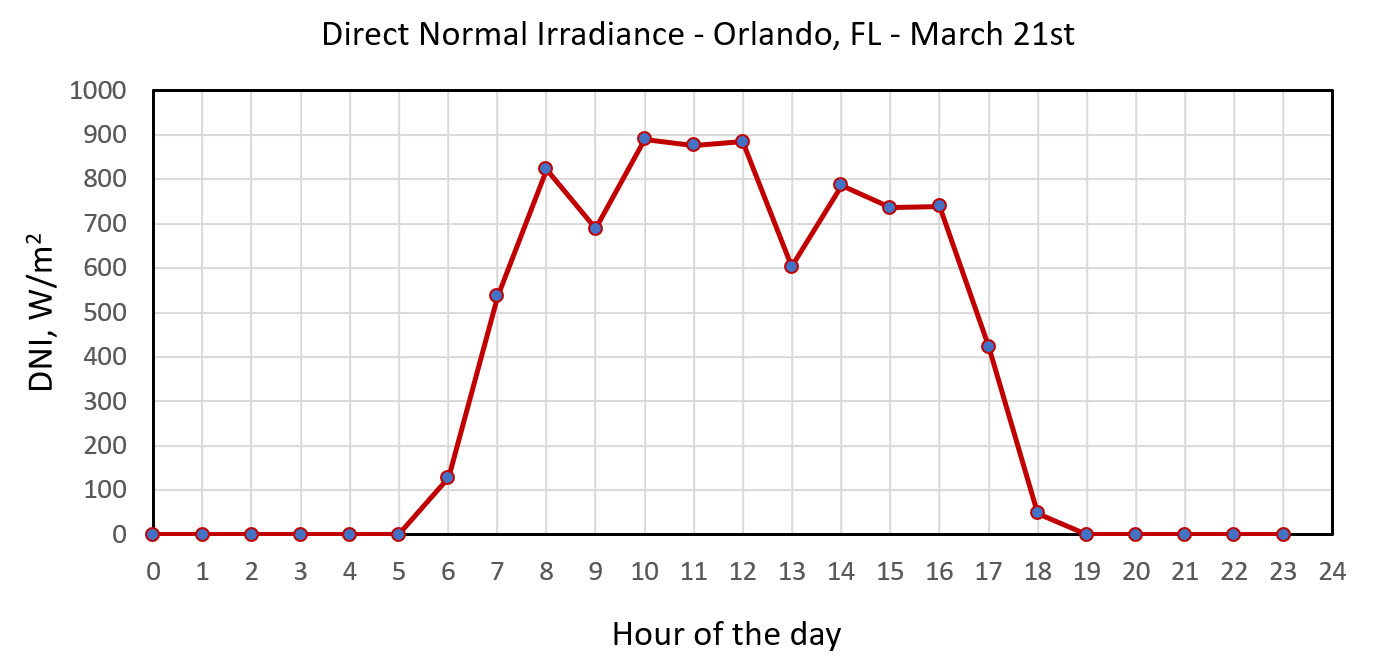
| DNI | Direct Normal Irradiance (W/m2) | Measured on the surface perpendicular to the beam | Pyrheliometer |
|
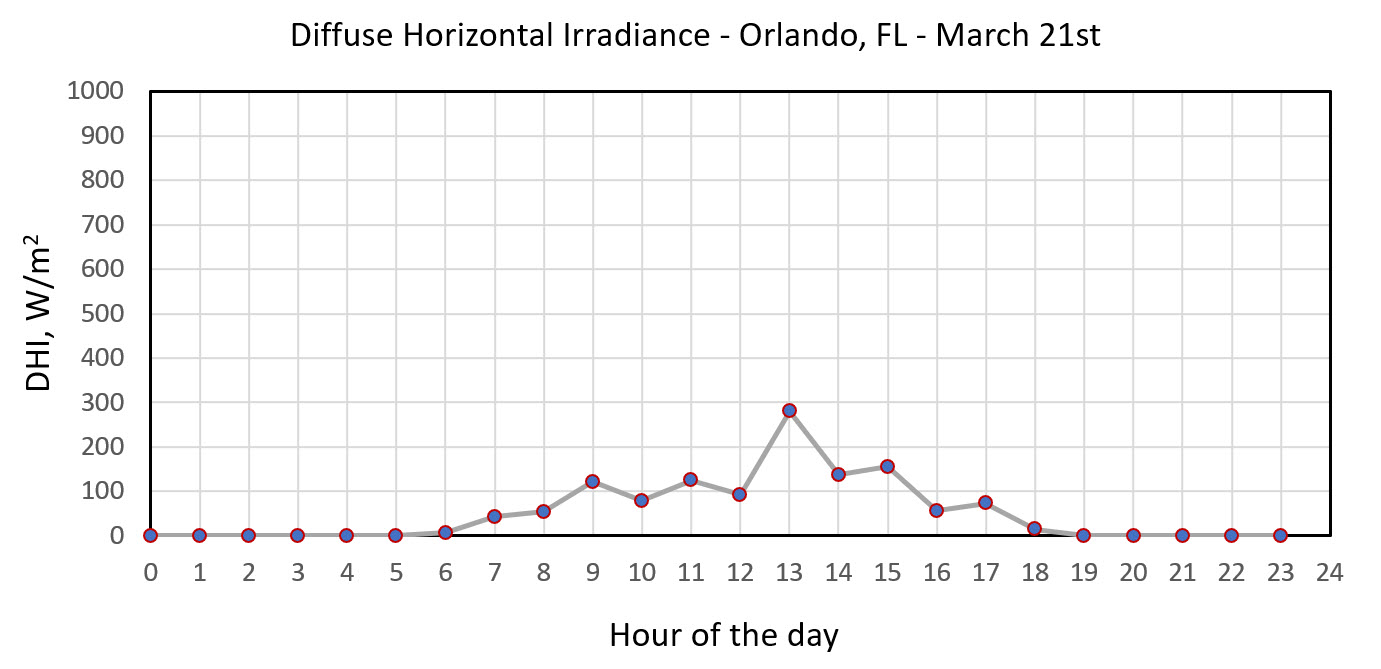
DHI |
Diffuse Horizontal Irradiance (W/m2) (also may be denoted DIFF) | Measured on the horizontal surface | Pyranometer (shaded) |
| GHI | Global Horizontal Irradiance (W/m2) - includes both beam and diffuse components | Measured on the horizontal surface | Pyranometer |
Theoretically, these three metrics are interrelated:

However, in practice, field measurements may somewhat deviate from this relationship.
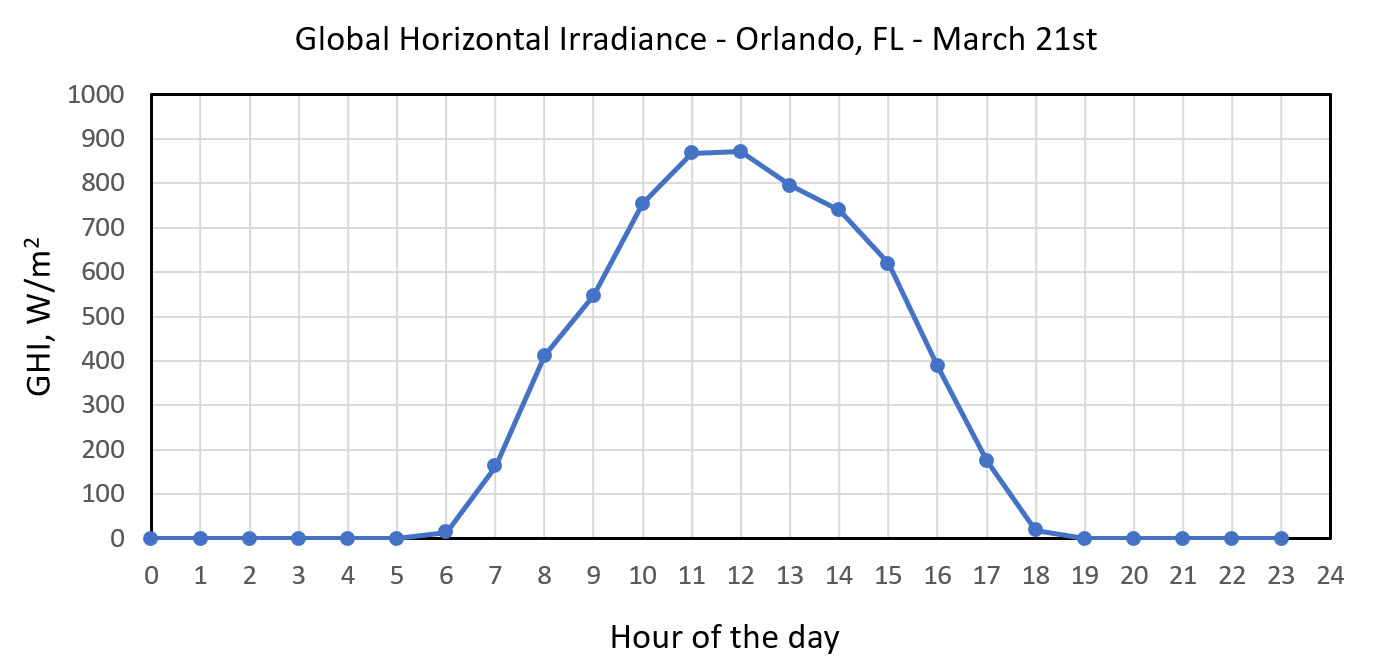
A typical solar resource data file (Typical Meteorological Year or TMY) would include all of these metrics measured for a specific location for each hour for each day in a year. Note that these values (measured in W/m2) indicate the instantaneous solar flux, which of course will vary during the day. In the morning and in the evening, the irradiance will be lower, but it will often reach its peak around solar noon. If there are clouds or other weather phenomena, the irradiance will temporarily drop.
The plots below give you an example of such variance. The GHI, DNI, and DHI data are plotted for the day of March 21st (equinox) in Orlando, FL. While it seemed to be a relatively sunny day (the beam component evidently dominates over diffuse, reaching ~900 W/m2), there are some minor interruptions (possibly from clouds) to this profile.
The TMY files with all these metrics given for each day for different locations around the globe are publicly available from the NSRDB database.
Try This!
Here is how you can download a solar resource file from the NSRDB Database. You can use this file in System Adviser Model (SAM) simulations or just for retrieving irradiance values for your locale for any specific day in a year.
Video: Download Weather File from the NSRDB (4:50)
Intro
In this video, I'll demonstrate how to download a weather file from the National Solar Radiation database to use in SAM.
Download Weather File
The first thing I'll want to do is to open a web browser and go to nsrdb dot nrel dot gov, and then click the blue nsrdb viewer button. Then I'll click download and, starting on the intro tab, I will type an email address. You'll want to type your own email address here and then click get started. Then on the data and location tab it asks me to select a layer. I want to download TMY data. So, I'm going to choose the USA and America's typical meteorological year data option, but you could choose any of the other ones.
And then for the location, I'm going to enter coordinates manually. So, I'll choose this option, and then I'm going to use Google Maps to find the latitude and longitude of my location. So, let's say I'm downloading a file for the NREL visitor center. I'll right click on the map here and read the values from here. So, it's 39.7 and -105.2 and then I'll click next.
That takes me to the attributes tab, where I select attributes. By default, the attributes that SAM wants are already checked, but I could check these additional attributes if I wanted that data in my weather file. SAM would just ignore those. And then for select year I'm going to choose the most recent TMY data set. So I'll choose TMY 2020.
I could choose more than one data set to choose to download more than one file. And then for the interval, I want 60 minutes data. That's all that's available. So I'll select that and then SAM needs the weather data to be in local time so I want to make sure that convert UTC to local time is checked. Then I click download and that should result in an email being sent. If I go off screen here and look at my email, I see an email from no reply at NREL dot gov.
It has the subject NREL data download ready. That might be in your junk folder, so you might want to check there. If you don't see the email and the email contains a link that I'll click to download the weather file.
Add Weather File to SAM
And if I look in my downloads folder, I'll see that there's this file. The zip file with a number for a file name. So, in order to use this data in SAM, I'm going to need to get the csv file that's inside the zip archive and put it in a folder on my computer and then tell SAM where that folder is. So, let's get that csv file out of this file out of the zip archive. I can extract it or just in windows, I can just copy it from the zip archive and paste it into another folder. I'm going to create a folder on my desktop.
I could put this folder anywhere on my computer, and then I'll paste the csv file here and then now I need to go to SAM. So, in SAM, I'll go to the location and resource page and add the folder. So, I'll click add remove weather file folders and then add and navigate to the folder that I just created which is on desktop and SRDB data, select folder and then click ok. So, what Sam does is it looks in that folder for any CSV files and scans them to see if they're a valid weather file. If the weather file is valid, then it adds it to the solar resource library, and then you can just select it in the solar resource library, check the data, and use it for your simulation.
Bookmark this video. It will help you get the data you need for SAM assignments later in this course or for your project.
Solar Maps
The GHI data are also used to generate solar resource maps. However, the instantaneous values of global irradiance are not best for mapping due to their continuous variability. Instead, GHI are integrated to determine the daily average irradiation (total energy from the sky).
Look again at the GHI plot (blue curve above) – essentially, this total daily energy will be equal to the area under the irradiance curve! This total daily irradiation value (measured in kWh/m2/day) can be better related to the total energy converted and delivered by your solar system. In a practical sense, it is a more intuitive metric to map.
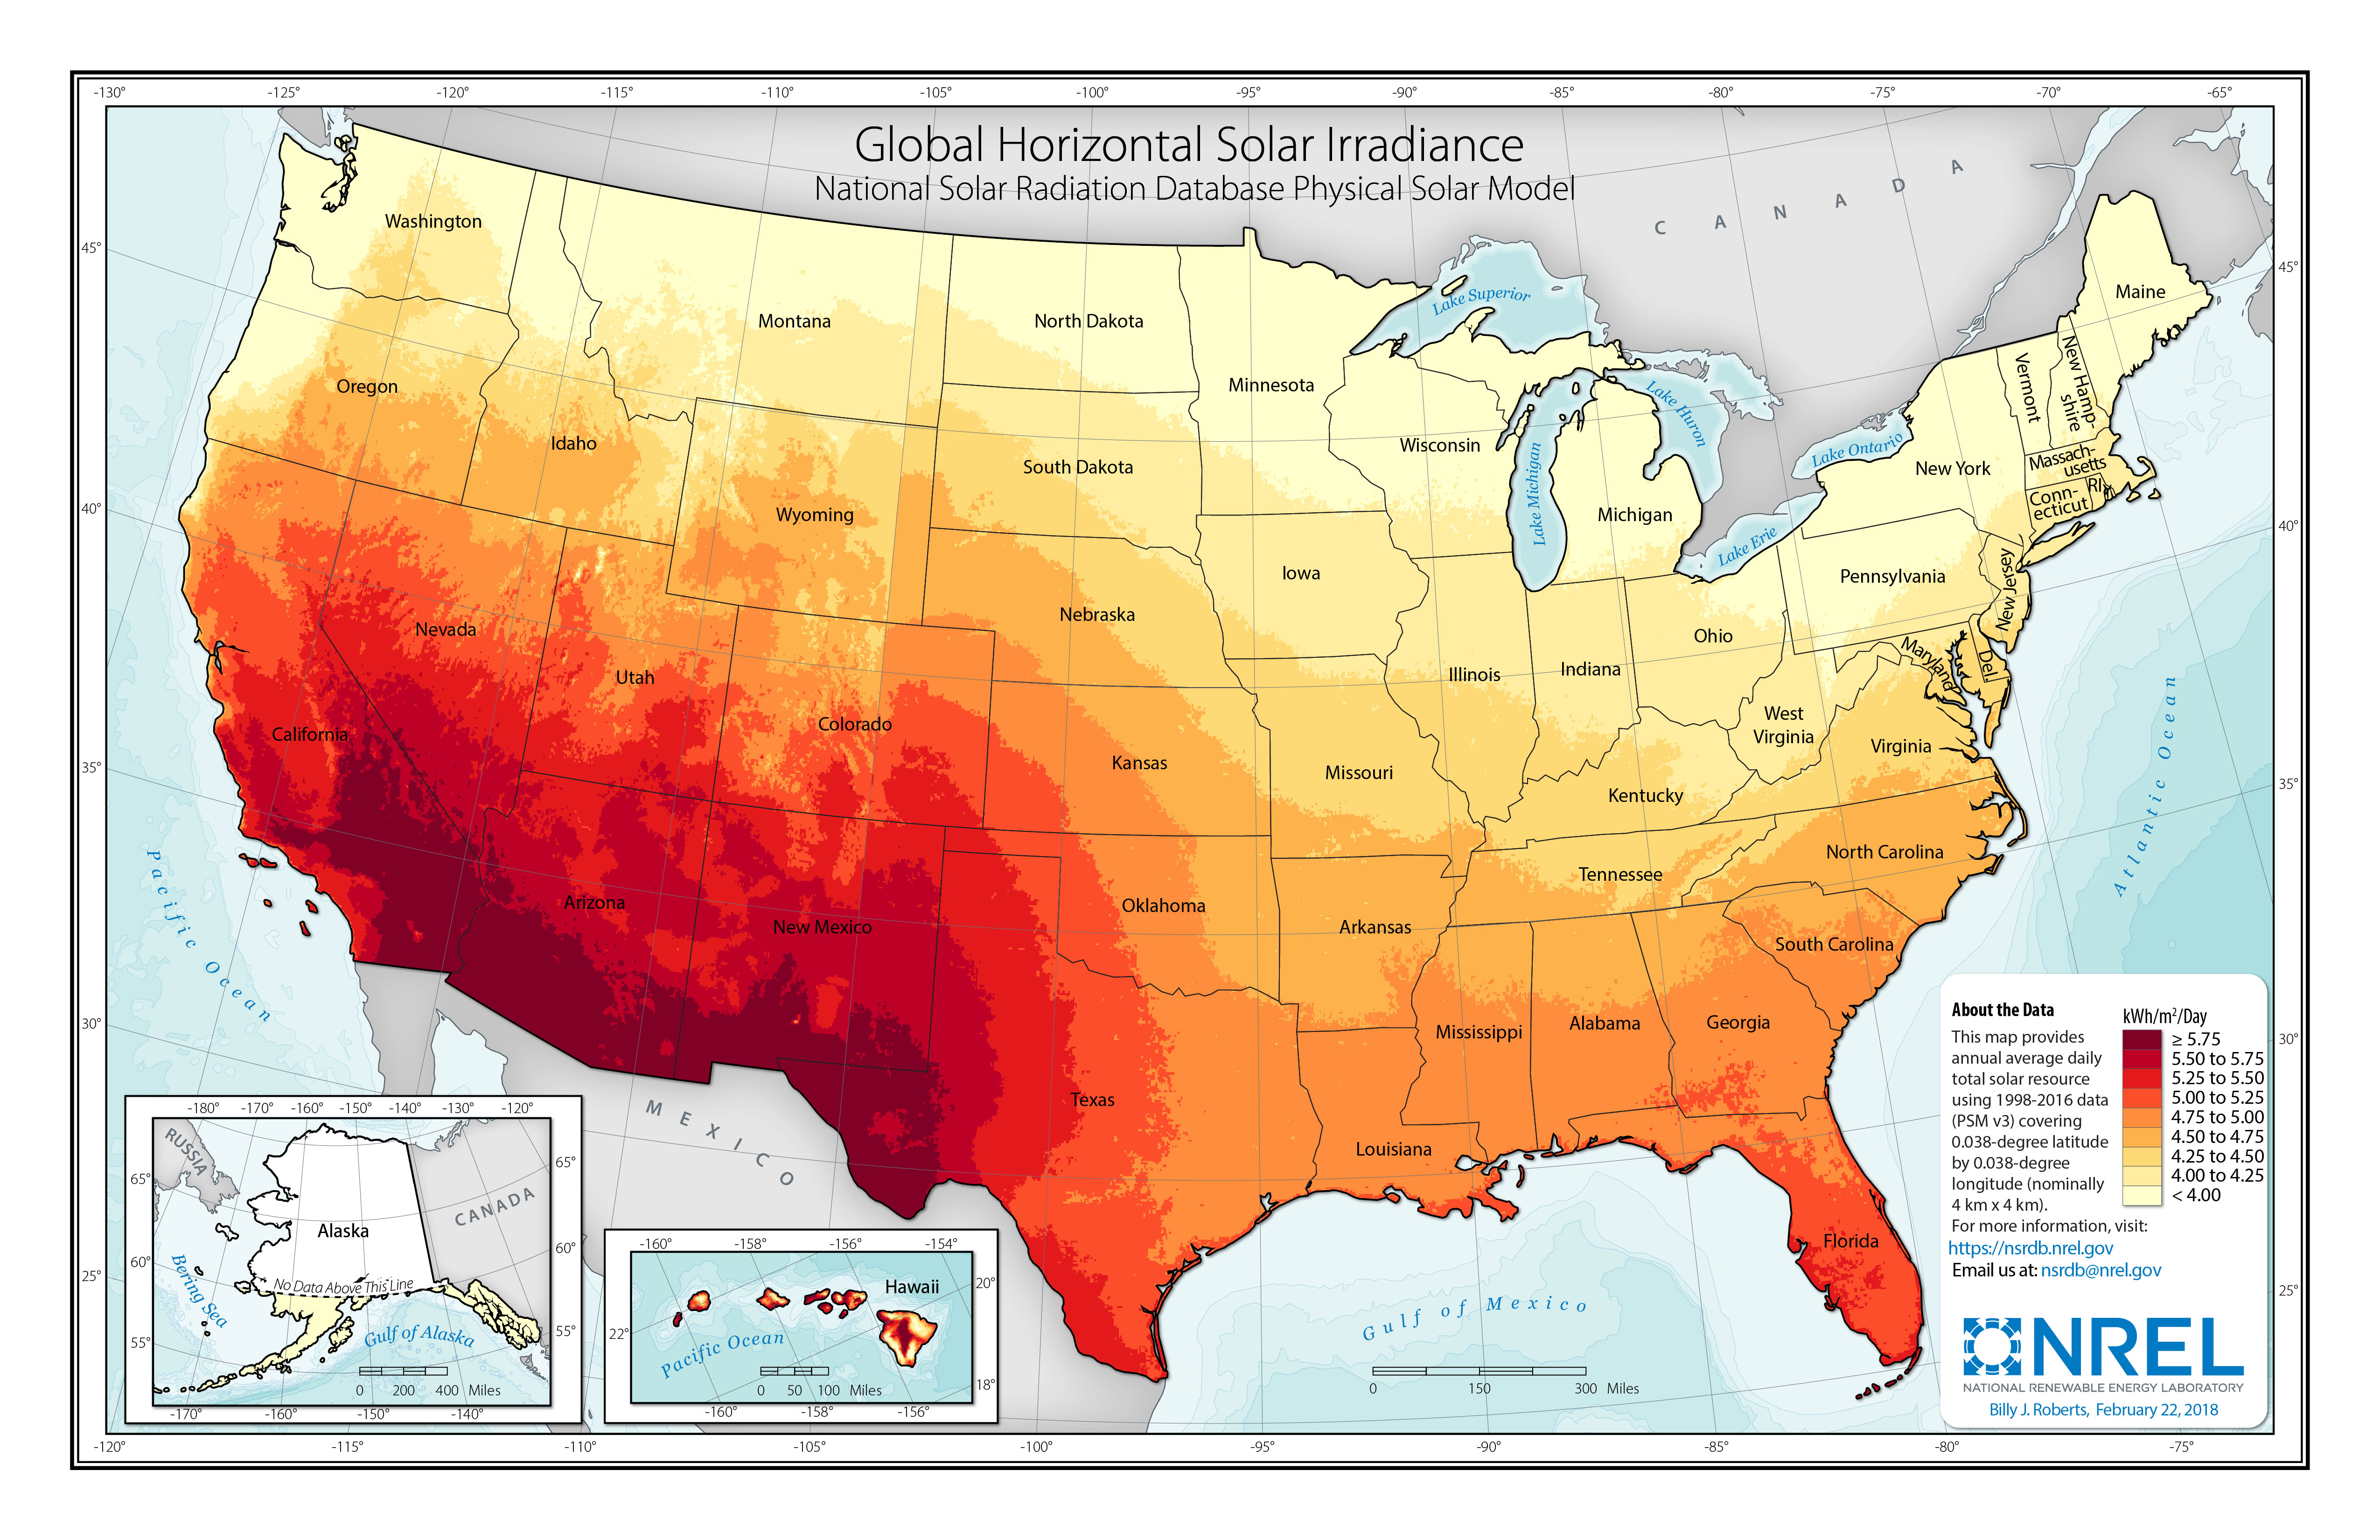
Also, let’s not forget the seasonal variations. The solar daily irradiation will be understandably higher during summer months and lower during winter months. Hence, the map below is based on the annual average values of daily irradiation.
Probing Question
Let’s take another look at the daily irradiance profile for Central Florida (blue curve): by integrating the GHI over the hours of the day, we can estimate the daily total irradiation at ~6.37 kWh/m2/day.
Now let’s look at the solar resource map. The Central Florida location would correspond to only 5-5.25 kWh/m2/day.
What is the reason for this difference? Which value should we consider for modeling our solar system performance?
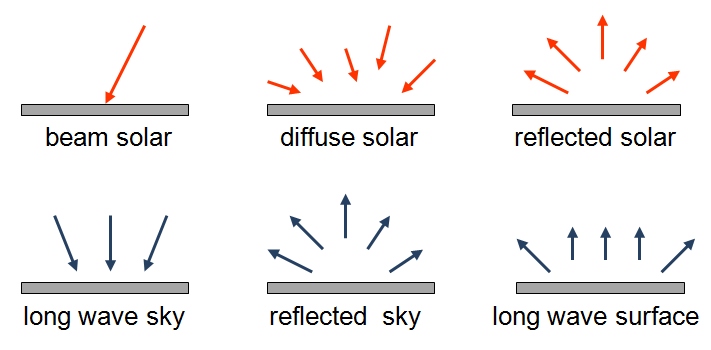
Short-Wave and Long-Wave
Short-wave radiation, in the wavelength range from 0.3 to 3 μm, comes directly from the sun. It includes both beam and diffuse components.
Long-wave radiation, with wavelength 3 μm or longer, originates from the sources at near-ambient temperatures - atmosphere, earth surface, light collectors, other bodies.
The solar radiation reaching the earth is highly variable and depends on the state of the atmosphere at a specific locale. Two atmospheric processes can significantly affect the incident irradiation: scattering and absorption.
Scattering is caused by interaction of the radiation with molecules, water, and dust particles in the air. How much light is scattered depends on the number of particles in the atmosphere, particle size, and the total air mass the radiation comes through.
Absorption occurs upon interaction of the radiation with certain molecules, such as ozone (absorption of short-wave radiation - ultraviolet), water vapor, and carbon dioxide (absorption of long-wave radiation - infrared).
Due to these processes, out of the whole spectrum of solar radiation, only a small portion reaches the earth's surface. Thus, most x-rays and other short-wave radiation is absorbed by atmospheric components in the ionosphere, ultraviolet is absorbed by ozone, and not-so abundant long-wave radiation is absorbed by CO2. As a result, the main wavelength range to be considered for solar applications is from 0.29 to 2.5 μm [Duffie and Beckman, 2013].
Transmittance
The effects of radiation scattering and absorption vary with the time of the day (due to the change of the air mass through which the beam passes through) and seasonally with the time of the year. Hence, the actual beam irradiance on the surface can be empirically estimated using a set of atmospheric parameters and Sun-Earth geometry.
Hottel’s method (Hottel 1976) describes the beam radiation transmitted through the atmosphere under the “clear-sky” conditions using atmospheric transmittance coefficient.
where G bn is the beam irradiance normal to the receiving surface, G on is the extraterrestrial irradiance (solar constant in a general case), and τ b is beam transmittance.
The transmittance value can be evaluated by Hottel’s model using solar zenith angle and altitude for several different climate regimes. Or, it can be determined by direct measurement of the beam irradiance on the normal surface.
Reading Assignment
This is the description of the Hottel’s method for the calculation of the atmospheric transmittance. Please take a look.
Book chapter: Duffie, J.A. Beckman, W., Solar Engineering of Thermal Processes , Chapter 2 pp. 68-70.
This section also provides a couple of examples that show how to estimate transmittance for a specific locale. This material will be helpful for solving problem #4 in your homework.
Instruments
The amount of solar radiation on the earth's surface can be instrumentally measured, and precise measurements are important for providing background solar data for solar energy conversion applications.
Described below are the most important types of instruments to measure solar radiation:
- Pyrheliometer is used to measure direct beam radiation at normal incidence. There are different types of pyrheliometers. According to Duffie and Beckman (2013), Abbot silver disc pyrheliometer and Angstrom compensation pyrheliometer are important primary standard instruments. Eppley normal incidence pyrheliometer (NIP) is a common instrument used for practical measurements in the US, and Kipp and Zonen actinometer is widely used in Europe. Both of these instruments are calibrated against the primary standard methods.
Based on their design, the above listed instruments measure the beam radiation coming from the sun and a small portion of the sky around the sun. Based on the experimental studies involving various pyrheliometer design, the contribution of the circumsolar sky to the beam is relatively negligible on a sunny day with clear skies. However, a hazy sky or a uniform thin cloud cover redistributes the radiation so that the contribution of the circumsolar sky to the measurement may become more significant.
-
Pyranometer is used to measure total hemispherical radiation - beam plus diffuse - on a horizontal surface. If shaded, a pyranometer measures diffuse radiation. Most of solar resource data come from pyranometers. The total irradiance (W/m2) measured on a horizontal surface by a pyranometer is expressed as follows:
\[{I_{tot}} = {I_{beam}}\cos \theta + {I_{diff}}\] (2.1) where θ is the zenith angle (i.e., angle between the incident ray and the normal to the horizontal instrument plane.
Examples of pyranometers are Eppley 180o or Eppley black-and-white pyranometers in the US and Moll-Gorczynsky pyranometer in Europe. These instruments are usually calibrated against standard pyrheliometers. There are pyranometers with thermocouple detectors and with photovoltaic detectors. The detectors ideally should be independent on the wavelength of the solar spectrum and angle of incidence. Pyranometers are also used to measure solar radiation on inclined surfaces, which is important for estimating input to collectors. Calibration of pyranometers depends on the inclination angle, so experimental data are needed to interpret the measurements.
- Photoelectric sunshine recorder. The natural solar radiation is notoriously intermittent and varying in intensity. The most potent radiation that creates the highest potential for concentration and conversion is the bright sunshine, which has a large beam component. The duration of the bright sunshine at a locale is measured, for example, by a photoelectric sunshine recorder. The device has two selenium photovoltaic cells, one of which is shaded, and the other is exposed to the available solar radiation. When there is no beam radiation, the signal output from both cells is similar, while in bright sunshine, signal difference between the two cells is maximized. This technique can be used to monitor the bright sunshine hours.
A more detailed explanation of how these instruments work and what kind of data is obtained from those measurements is available in the following Duffie and Beckman (2013) book, referred below. Please spend some time acquiring basic knowledge on solar resource data. For everyone who took EME 810 and is more or less familiar with this topic, this still may be a useful refresher.
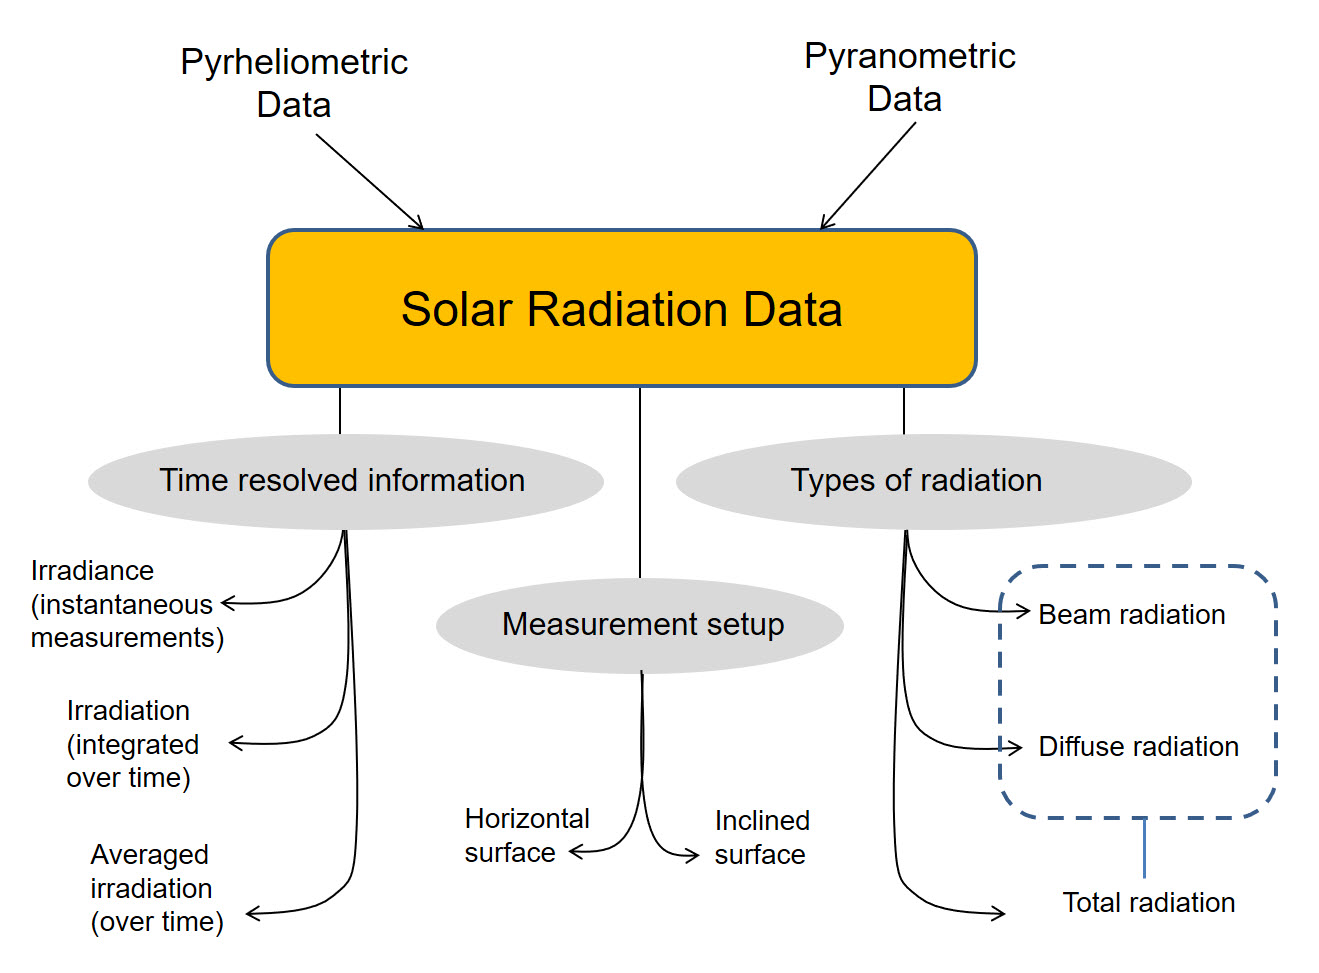
Solar radiation data collected through the above-mentioned instrumental methods provide the basis for development of any solar projects. We can summarize the types of solar resource data as follows:
Before moving on, please work through the following self-check questions to assess your learning:
Check Your Understanding - Questions 1-3
Check Your Understanding - Question 4
Can you write down the value of the solar constant? What is its units and meaning?
Check Your Understanding - Question 5
How would you estimate the beam radiation intensity on the earth's surface based on the solar constant and transmittance of the atmosphere of 0.5 at a certain location? Type in the number here:
Supplemental reading
NREL Report: Stoffel et al. (2010): Concentrating Solar Power: Best Practices Handbook for the Collection and Use of Solar Resource Data, NREL/TP-550-47465.
Book Chapter: Duffie, J.A. Beckman, W., Solar Engineering of Thermal Processes , Chapter 2.
Assuming that you have already learned about solar resource in your prerequisite courses, I suggest these readings as optional resources if you are inclined to dive deeper into this topic.