Base Data: Building a Map
Though many pre-designed options exist, and can be selected as described above, the best reference map for a specific task is often the one you make yourself. When downloading base data for a map, you should consider the following data layers, of which you might need a few or many. This is not an exhaustive list of available base data content, but will help you start thinking about the kinds of data you may need.
Terrain data
A good basemap will often include data that shows the shape of the physical landscape. All terrain layers are typically derived from a digital elevation model (DEM), which is a grid-based (raster) data layer that contains elevation layers.
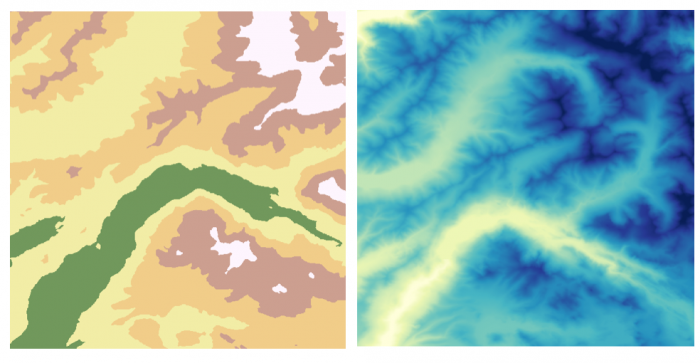
Elevation can be mapped in several different ways; a common method is hypsometric tinting (hypso) or coloring based on elevation values, shown in Figure 1.6.1.
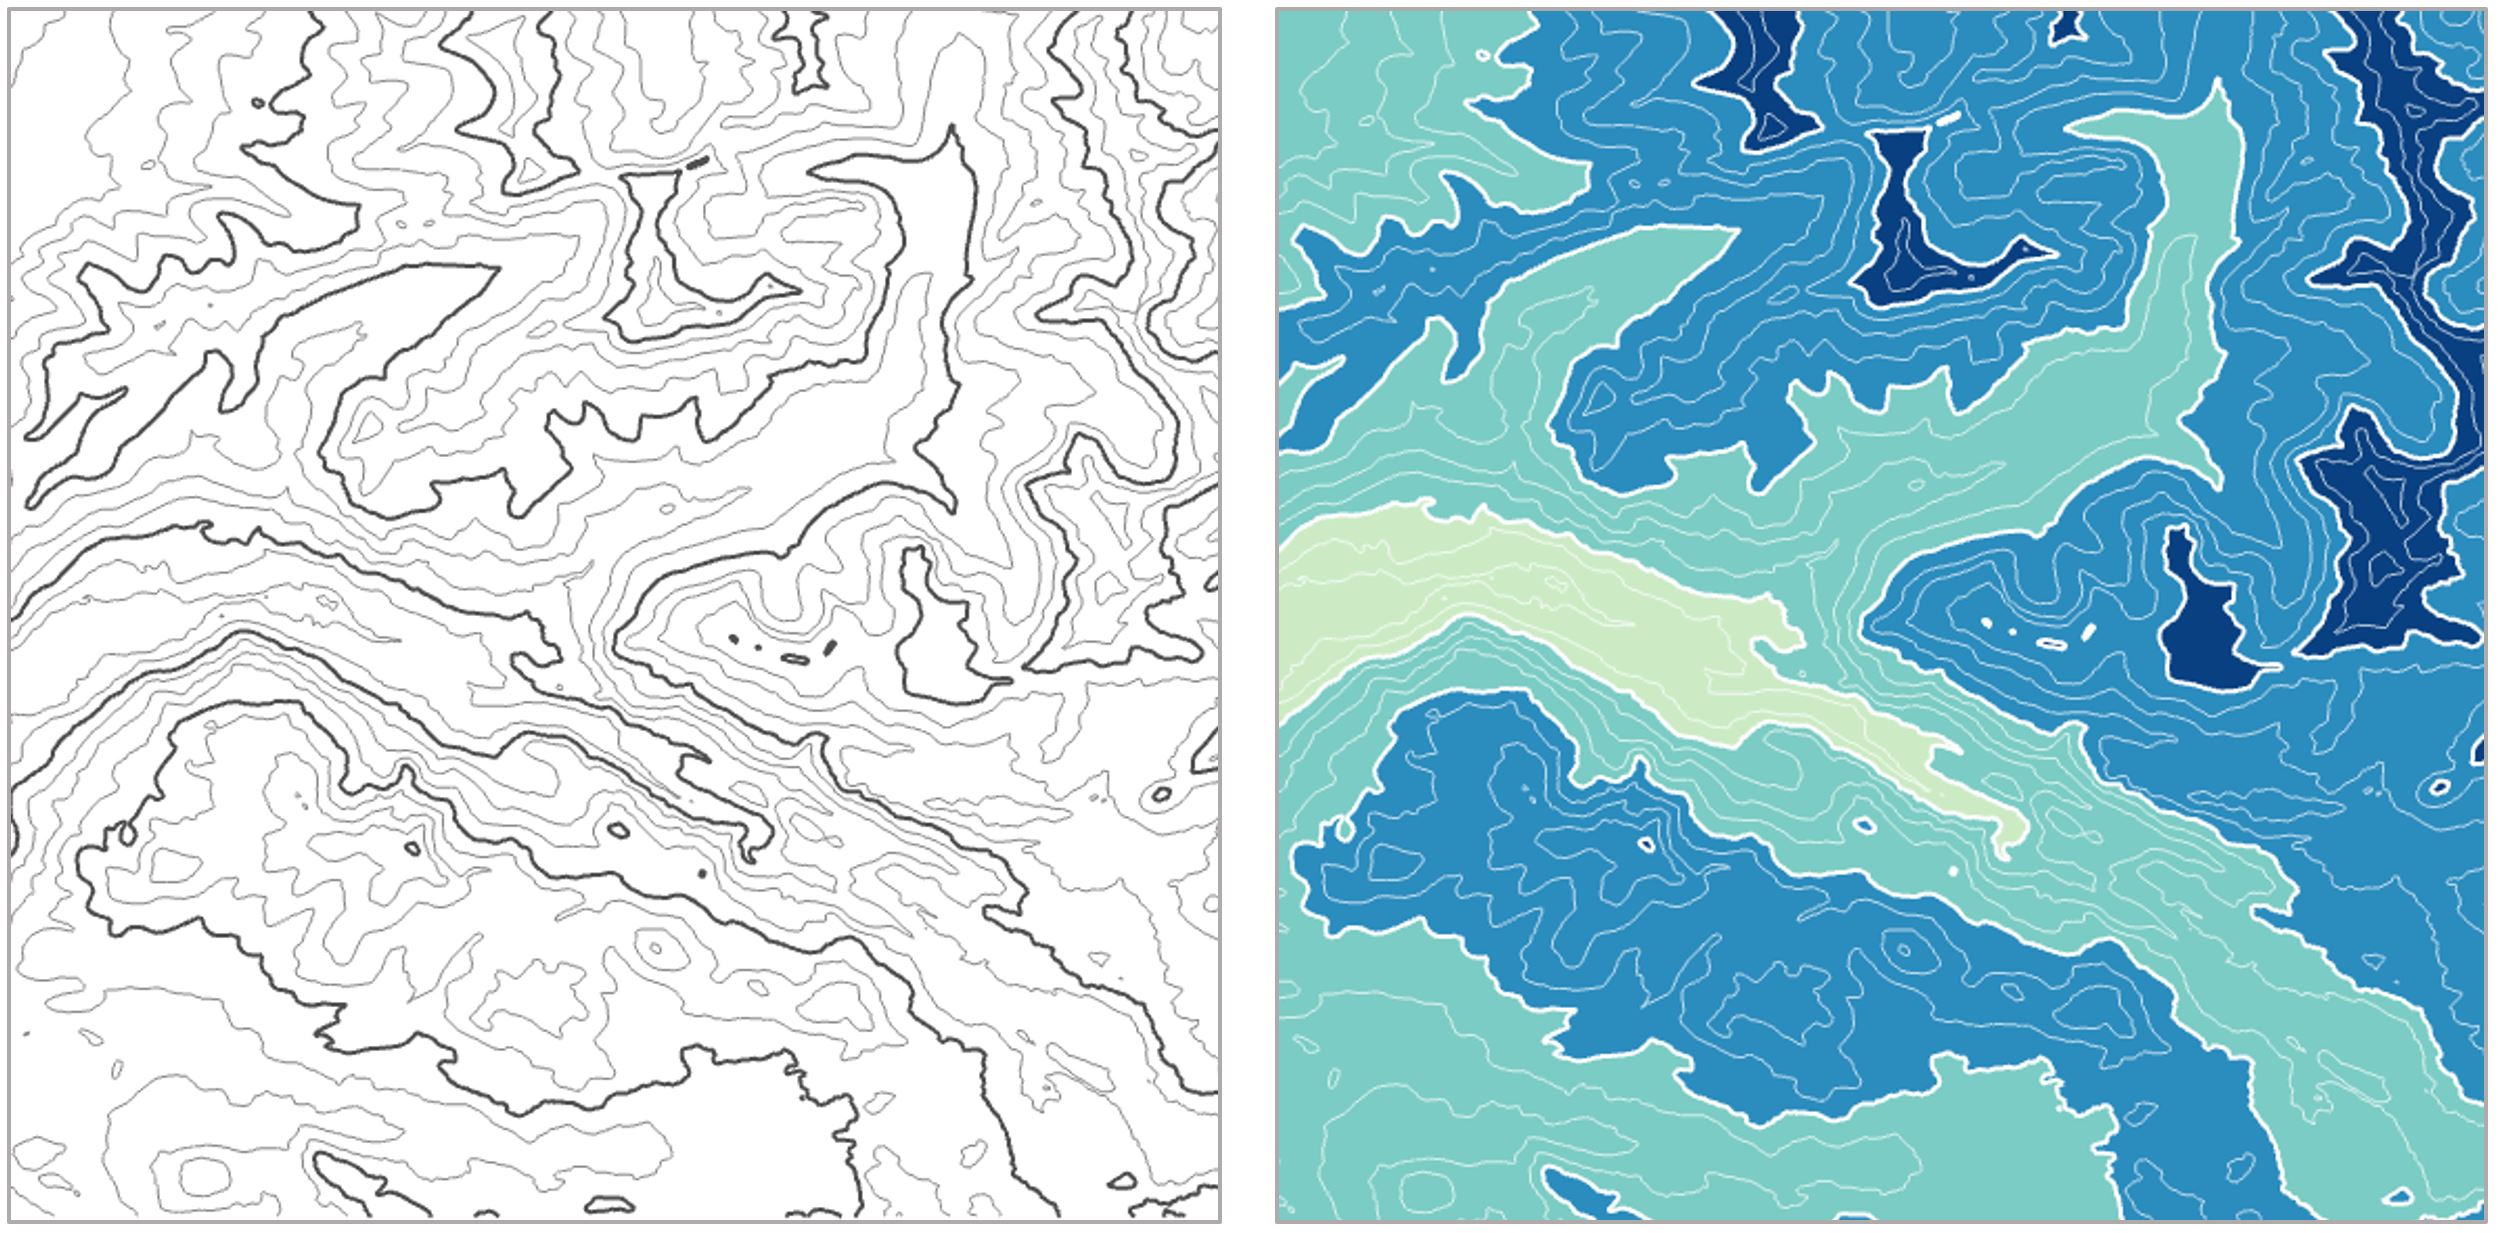
Contour lines are often used to show more detail about the shape of the landscape, either alone or combined with hypsometric tinting, as shown below.
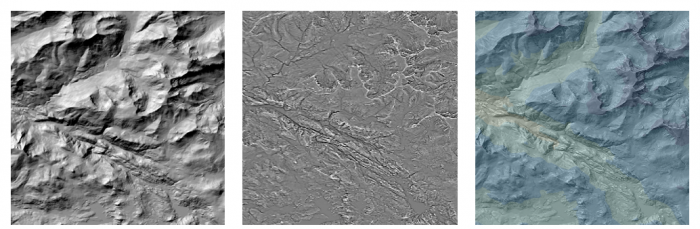
Other layers such as hillshade and curvature are often added for additional visual detail.
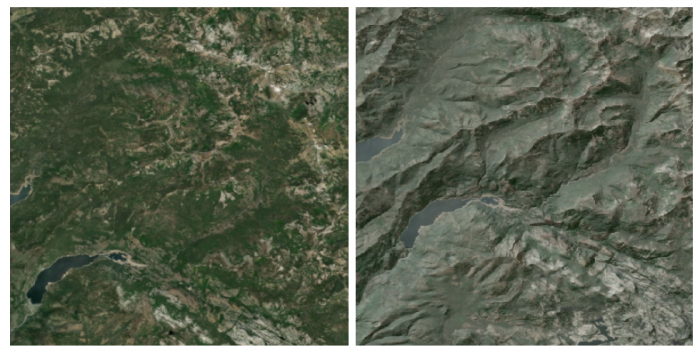
Orthoimages, or images of the earth’s surface that have been properly transformed for mapping purposes, can also be used alone or combined with terrain layers. We'll talk more about terrain visualization later in the course.
Cultural Data
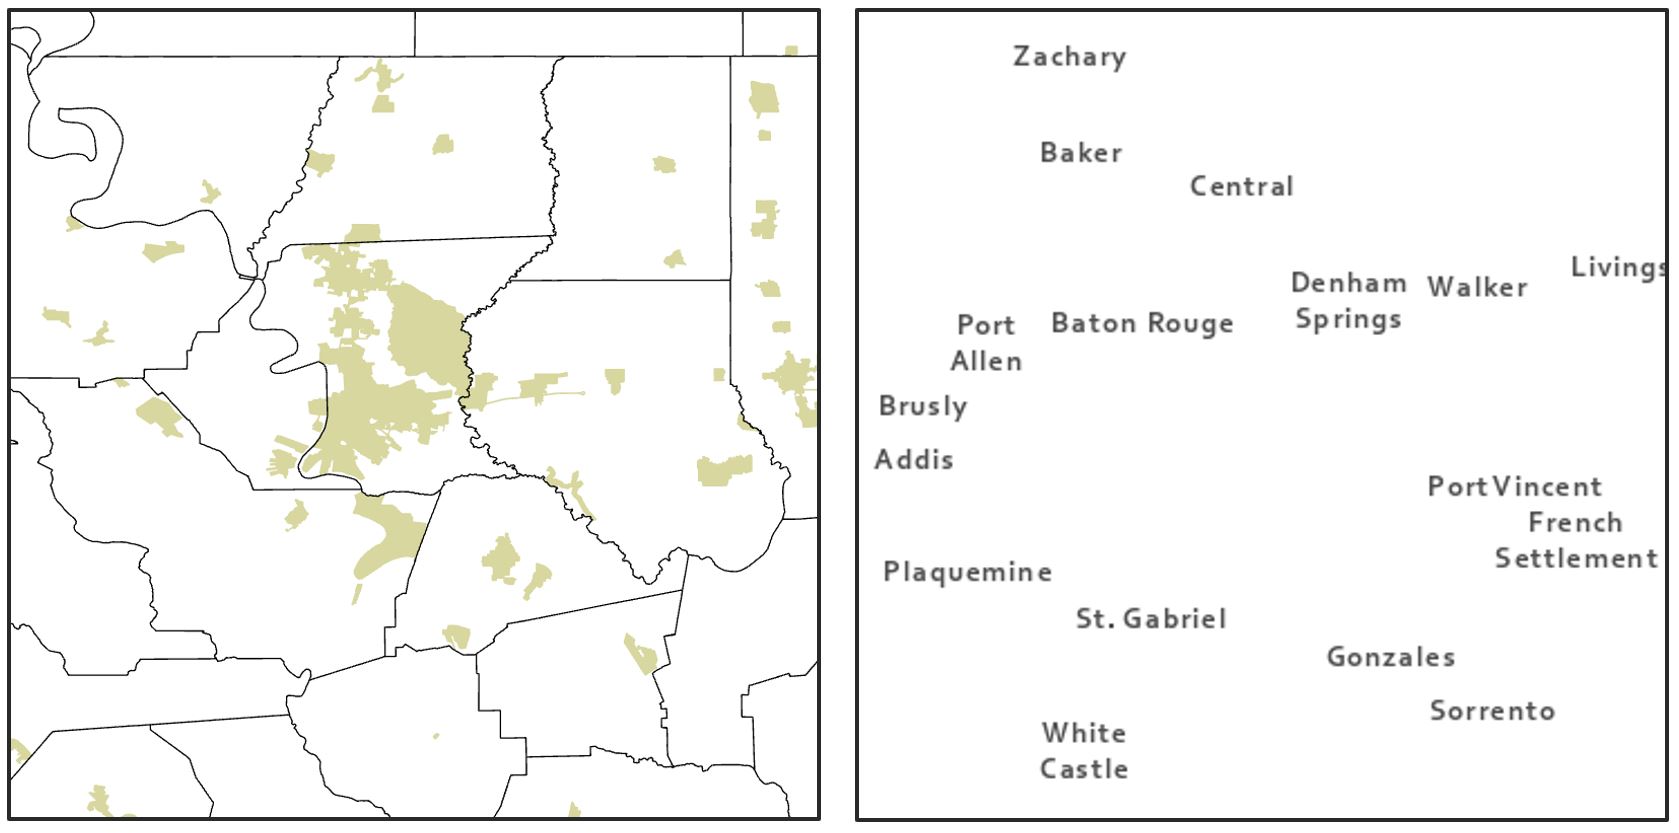
Political boundaries are often important components of basemap design. Commonly-mapped boundaries include international borders, state or province boundaries, incorporated places, smaller census units such as tracts and blocks, and boundaries of Native American reservations, among others. Place names are used to add additional locational context.
Additional Data
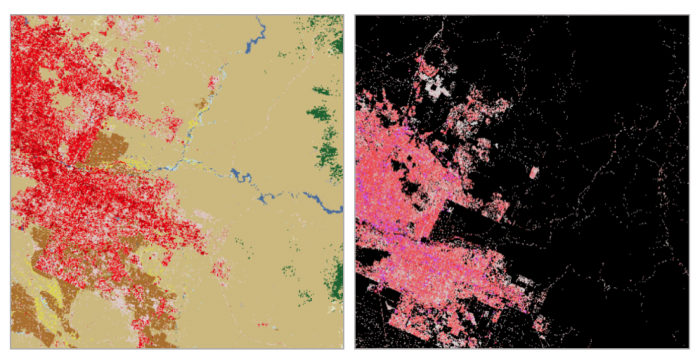
Other layers that can be useful as base data include zoning and land use data. These data are often available in vector form from local GIS organizations. Land cover and impervious surface data, among other layers, are available in raster form from the National Land Cover Database (NLCD).

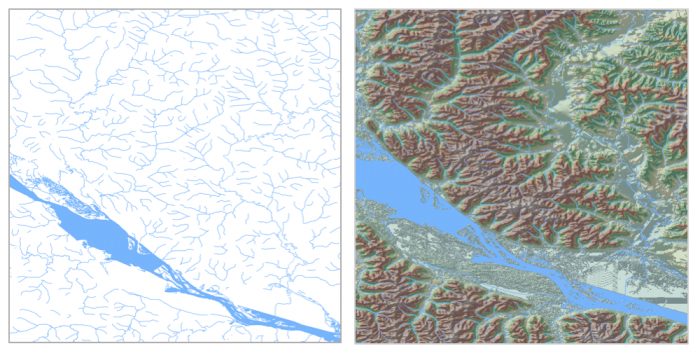
Hydrography can also play an important role in a basemap. Data used may include streams, rivers, lakes, swamps, marshes, and wetlands, among other water features.
Given the vast amount of data available, it is important to think carefully about the base data necessary for map’s audience, medium, and purpose—and design accordingly.
Recommended Reading
Chapter 2: Basemap Basics. Brewer, Cynthia A. 2015. Designing Better Maps: A Guide for GIS Users. Second Edition. Redlands: Esri Press.