Types of Maps
Maps are generally classified into one of three categories: (1) general purpose, (2) thematic, and (3) cartometric maps.
General Purpose Maps
General Purpose Maps are often also called basemaps or reference maps. They display natural and man-made features of general interest, and are intended for widespread public use (Dent, Torguson, and Hodler 2009).
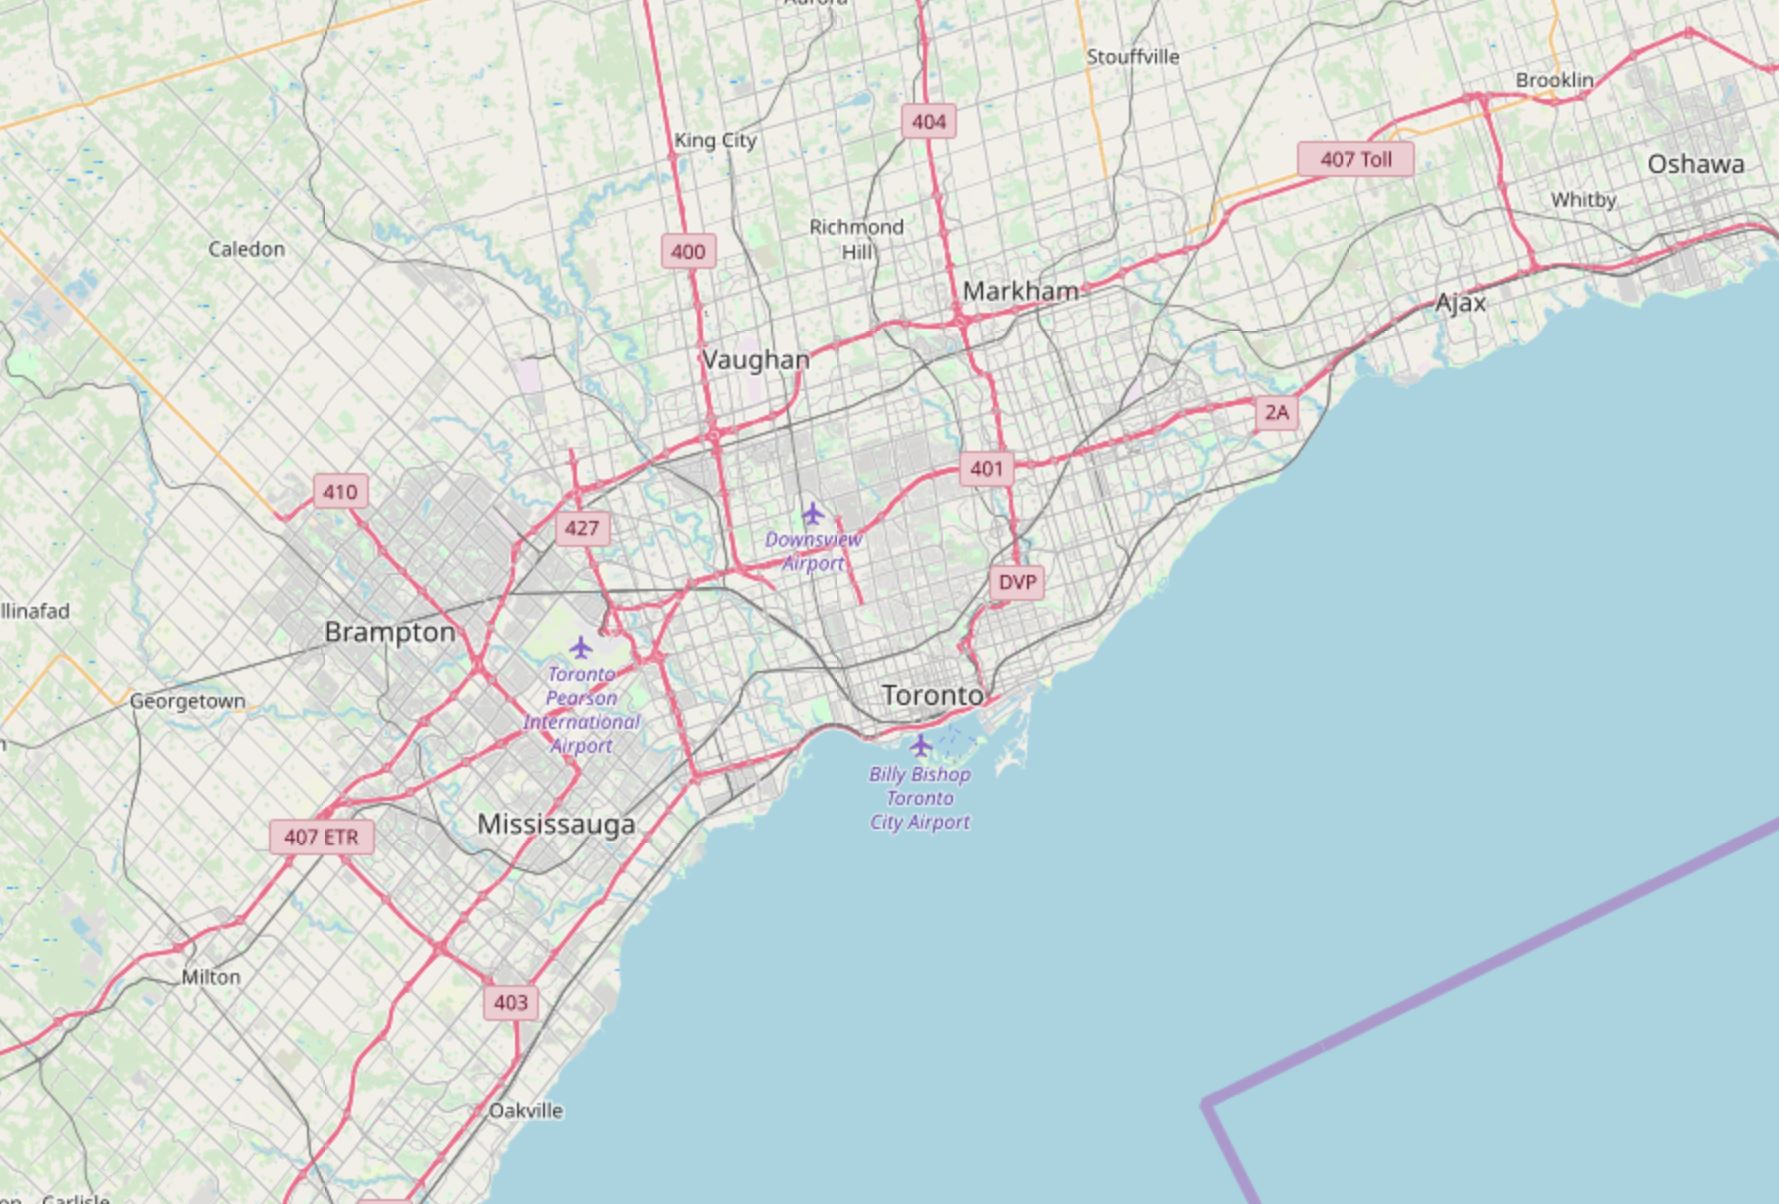
The data is available under the Open Database License (CC BY-SA(link is external)).
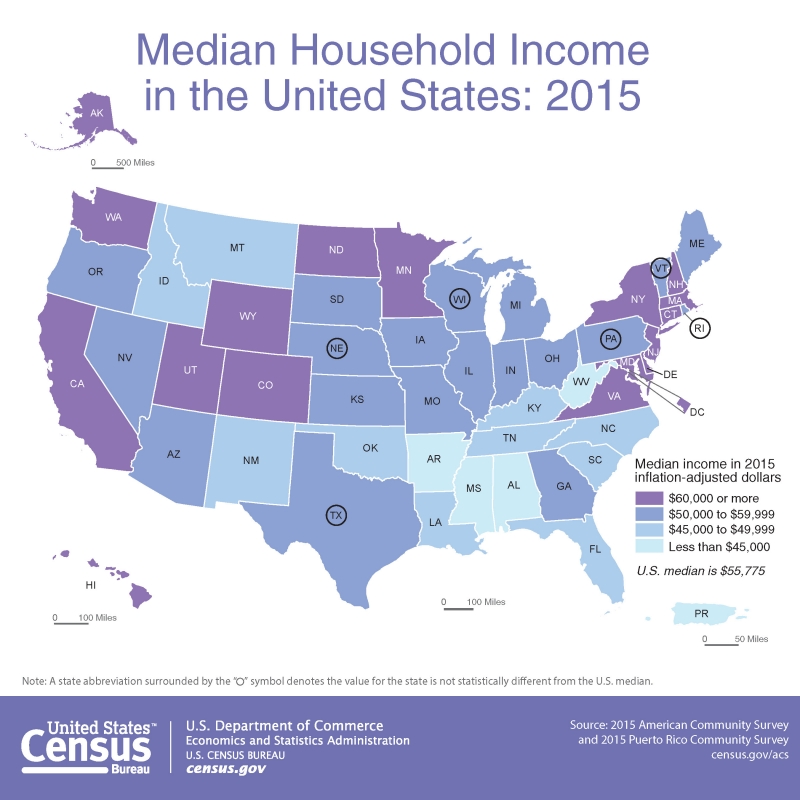
Thematic Maps
Thematic Maps are sometimes also called special purpose, single topic, or statistical maps. They highlight features, data, or concepts, and these data may be qualitative, quantitative, or both. Thematic maps can be further divided into two main categories: qualitative and quantitative. Qualitative thematic maps show the spatial extent of categorical, or nominal, data (e.g., soil type, land cover, political districts). Quantitative thematic maps, conversely, demonstrate the spatial patterns of numerical data (e.g., income, age, population).
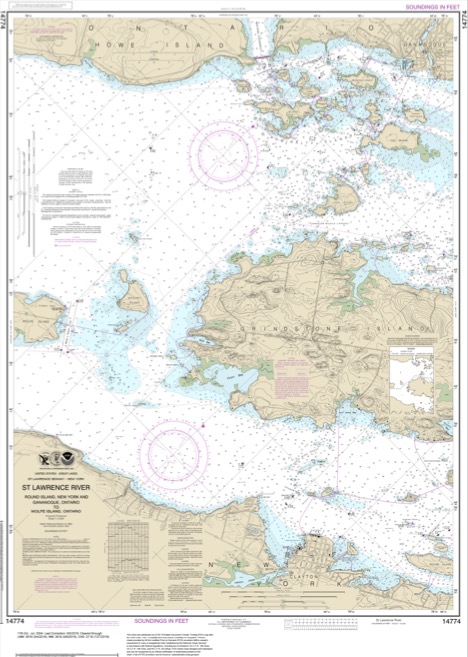
Cartometric Maps
Cartometric Maps are a more specialized type of map and are designed for making accurate measurements. Cartometrics, or cartometric analysis, refers to mathematical operations such as counting, measuring, and estimating—thus, cartometric maps are maps which are optimized for these purposes (Muehrcke, Muehrcke, and Kimerling 2001). Examples include aeronautical and nautical navigational charts—used for routing over land or sea—and USGS topographic maps, which are often used for tasks requiring accurate distance calculations, such as surveying, hiking, and resource management.
In theory, these map categories are distinct, and it can be helpful to understand them as such. However, few maps fit cleanly into one of these categories—most maps in the real world are really hybrid general purpose/thematic maps.
Advancements in technology and in the availability of data have resulted in the proliferation of many diverse types of maps. Some, as shown in Figure 1.2.5, are embedded into exploratory tools intended to inform researchers and policy-makers.
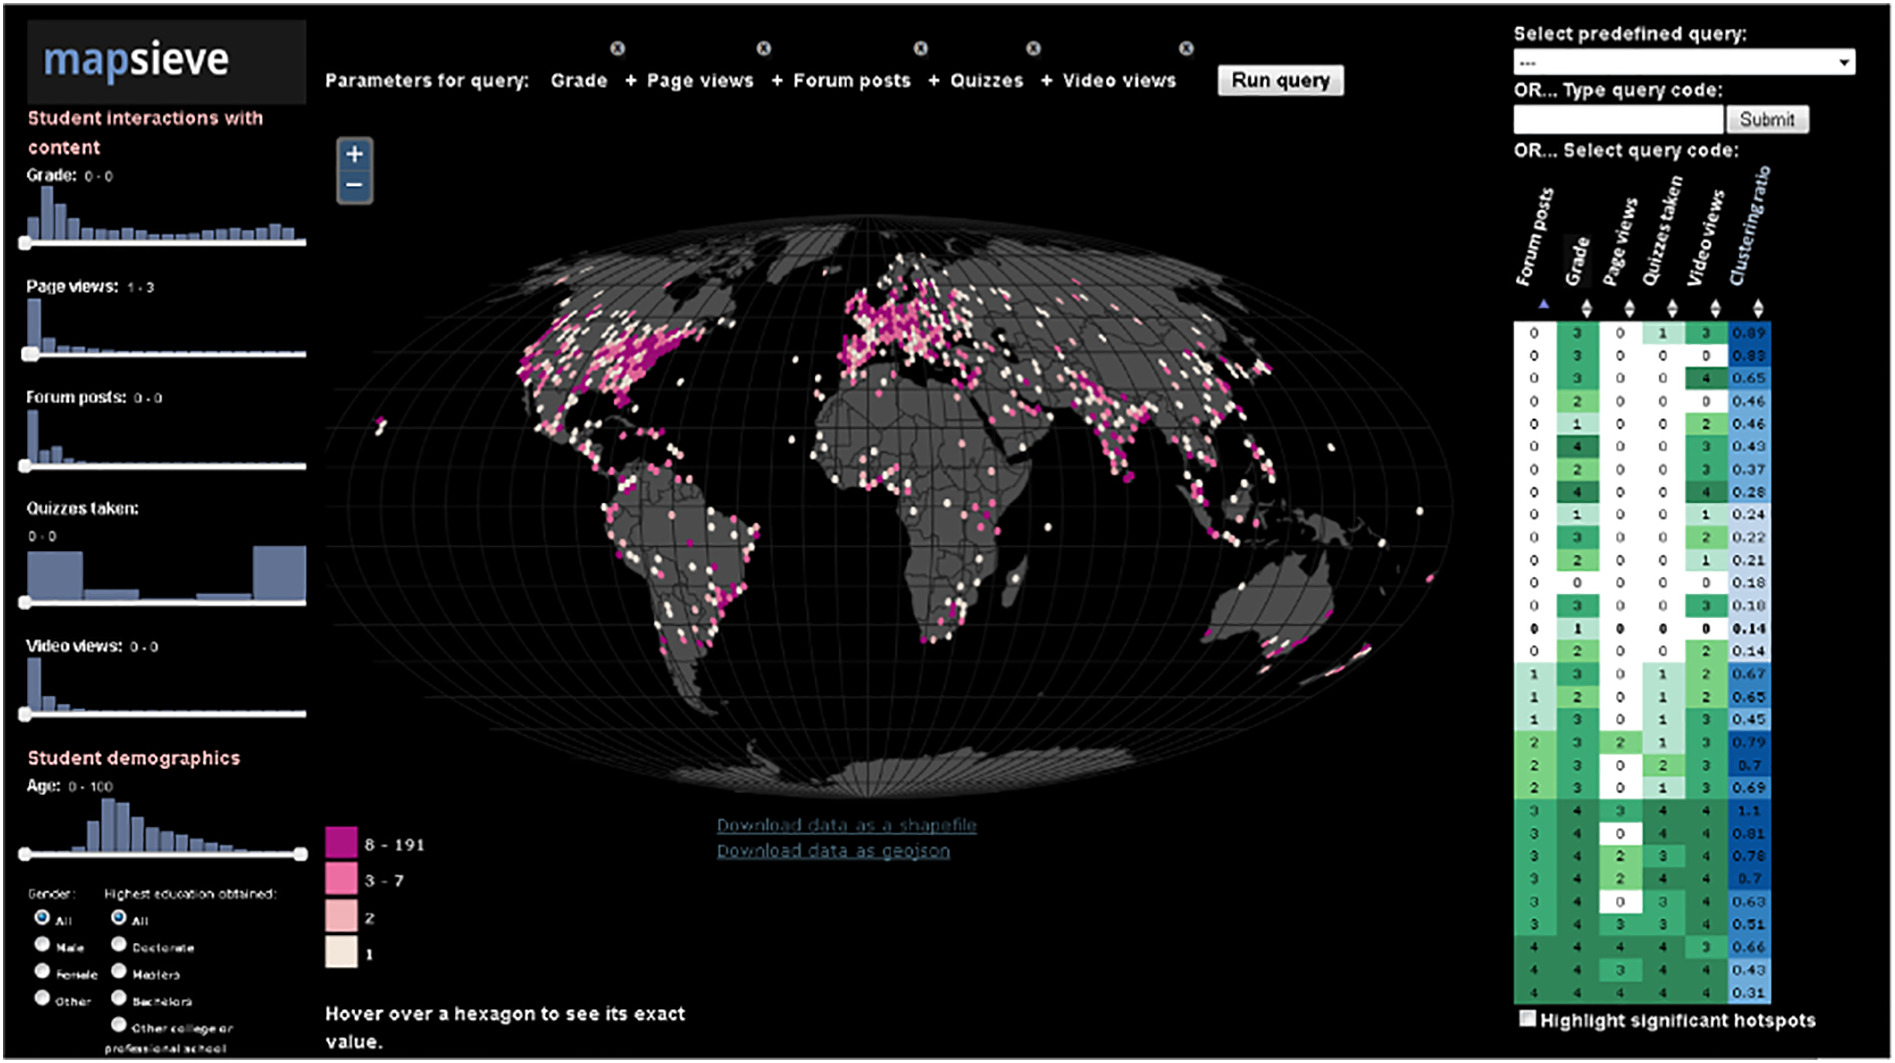
Reproduced with permission from Dr. Anthony Robinson, Penn State University.
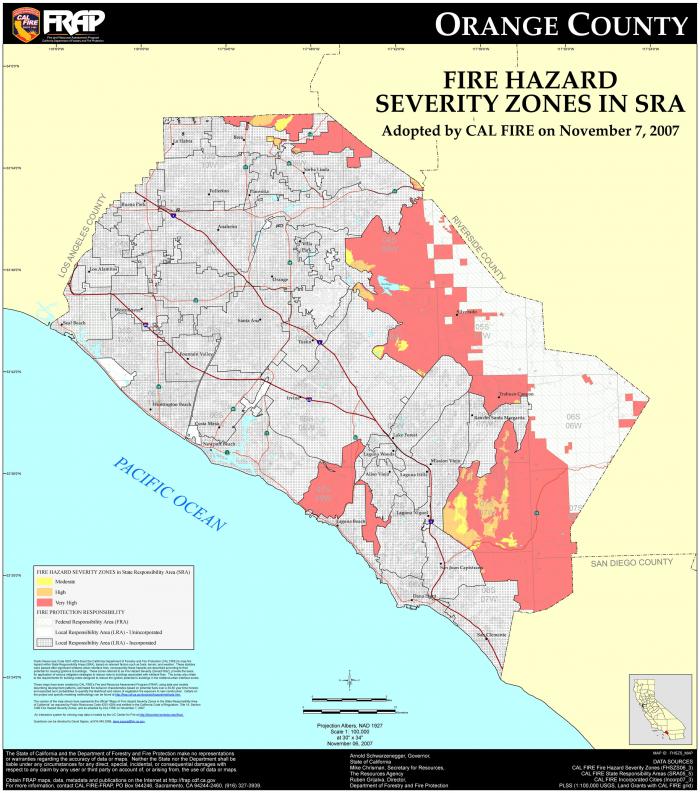
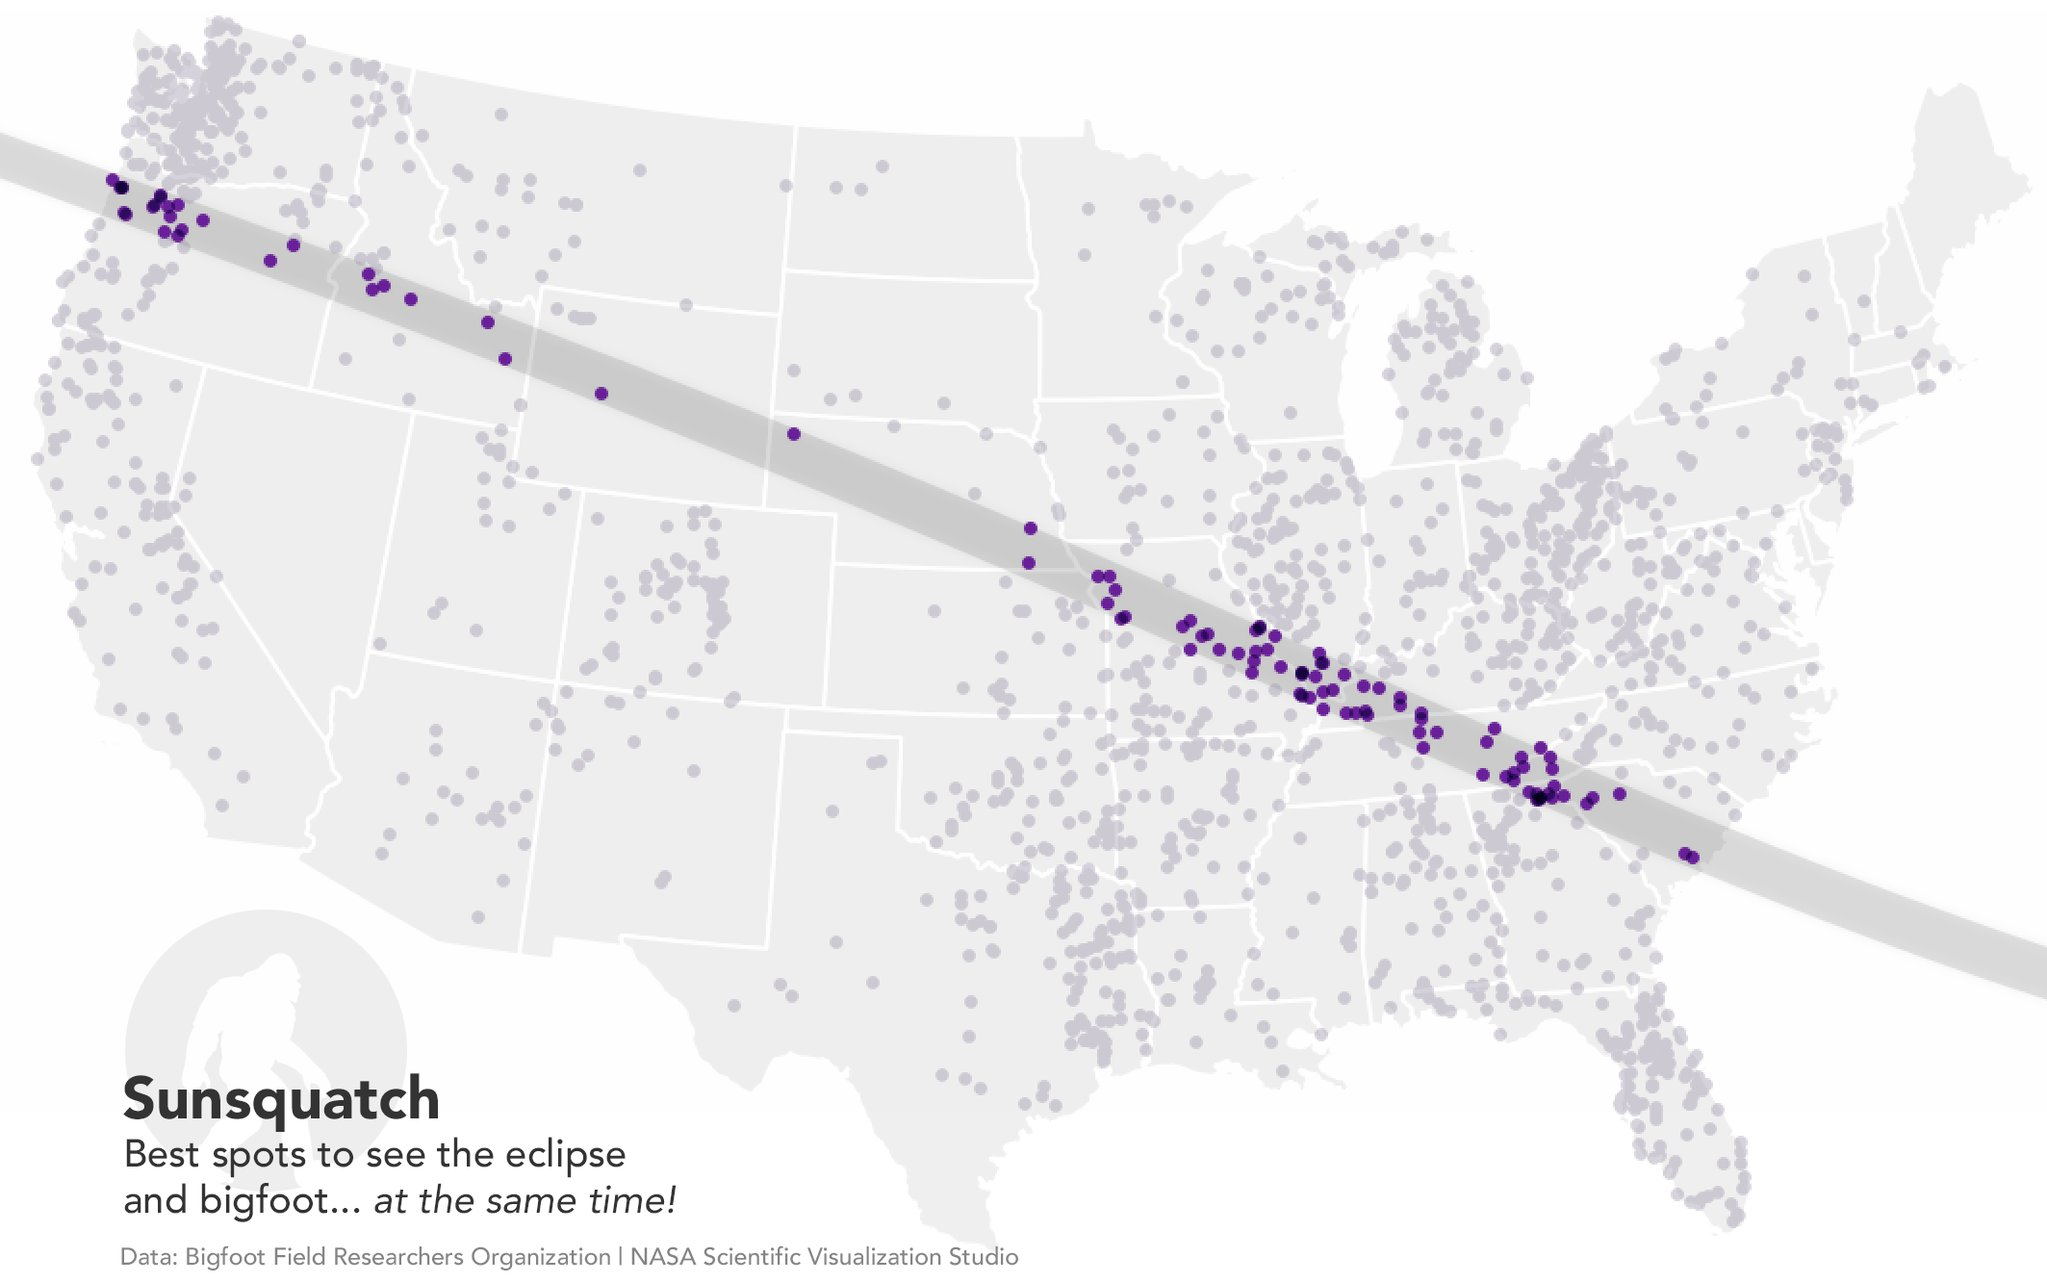
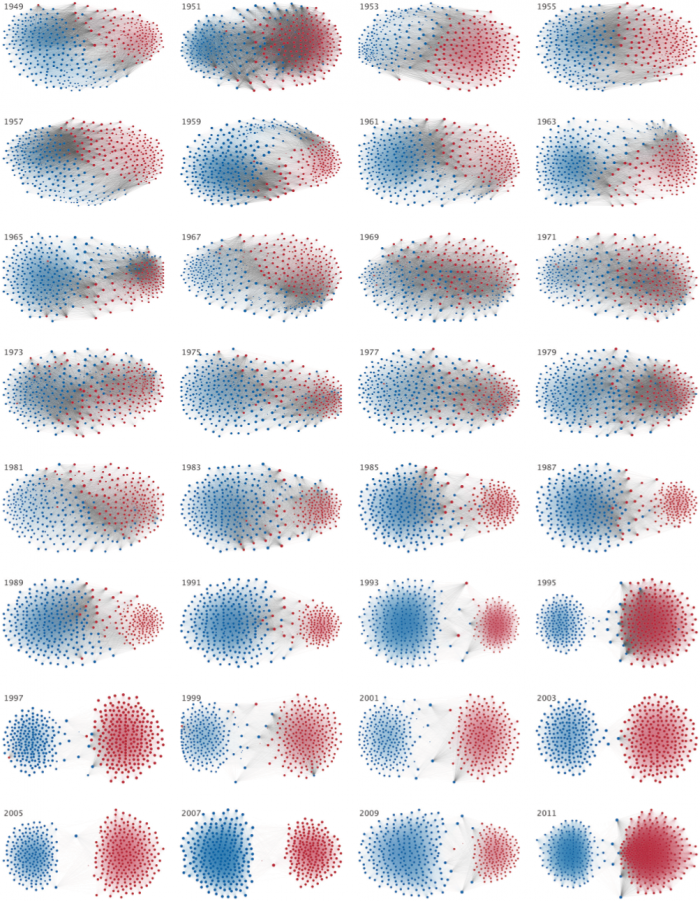
Other maps are intended for a wider audience but share the goal of uncovering and visualizing interesting relationships in spatial data (Figure 1.2.6).
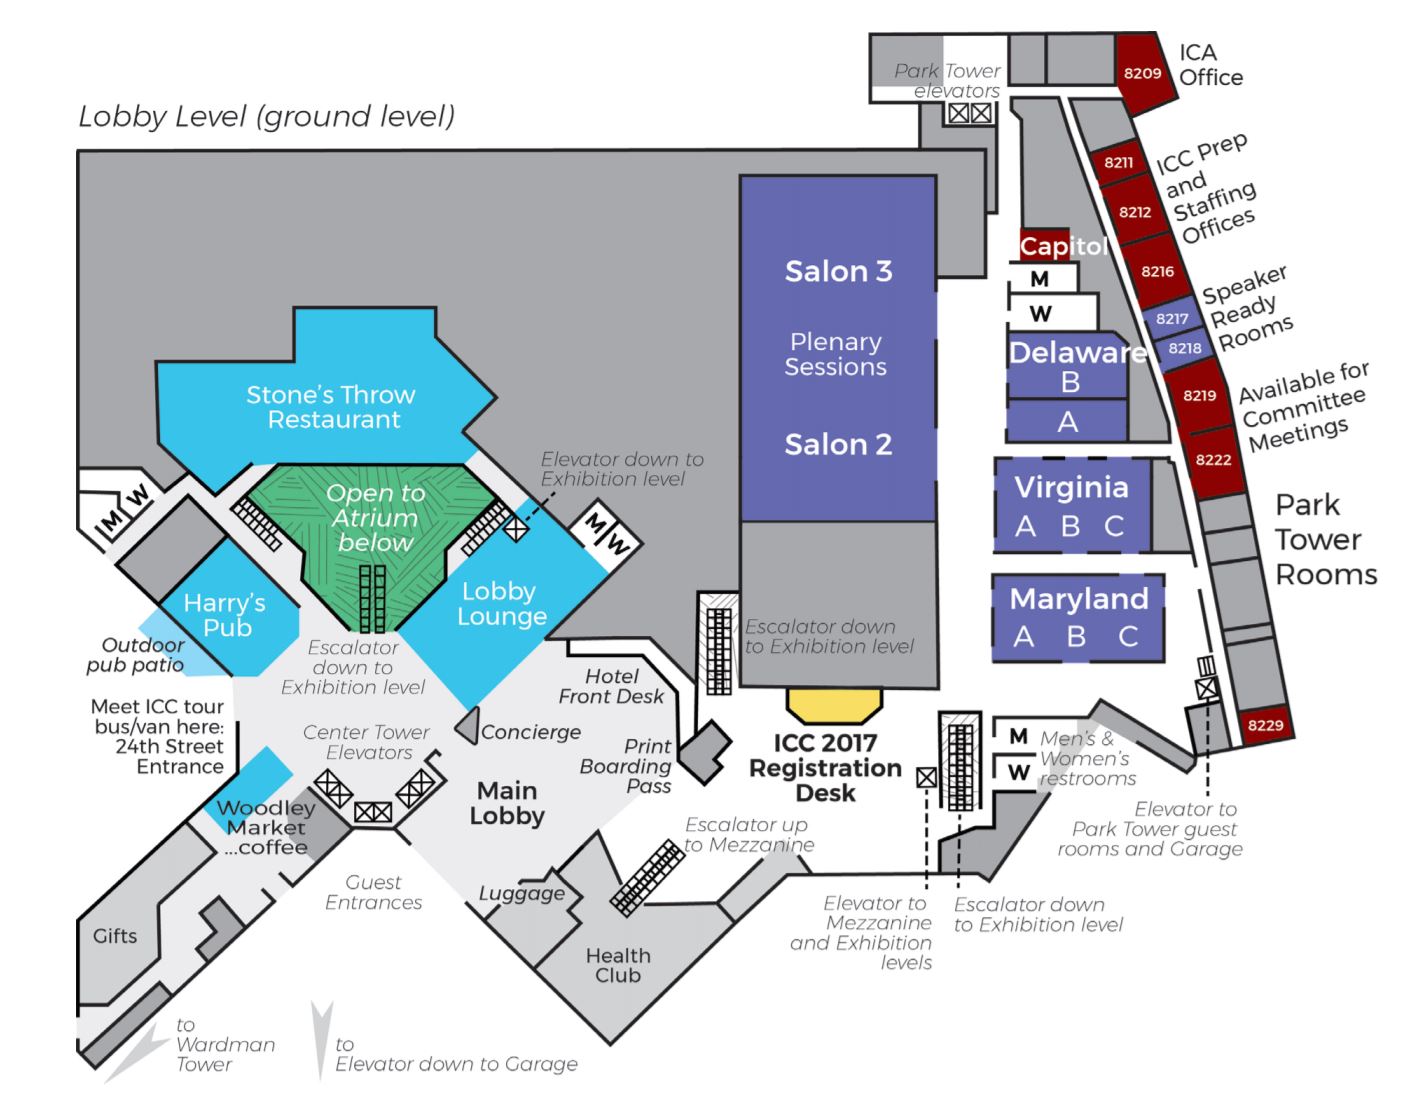
Maps also are not limited to depicting outdoor landscapes. Some maps, such as the one in Figure 1.2.7, are designed to help people navigate complicated indoor spaces, such as malls, airports, hotels, and hospitals.
For a map to be useful, it is not always necessary that they realistically portray the geography they represent. This map of the public transit system in Boston, MA (Figure 1.2.8) drastically simplifies the geography of the area to create a map that is more useful for travelers than it would be if it were entirely spatially accurate.
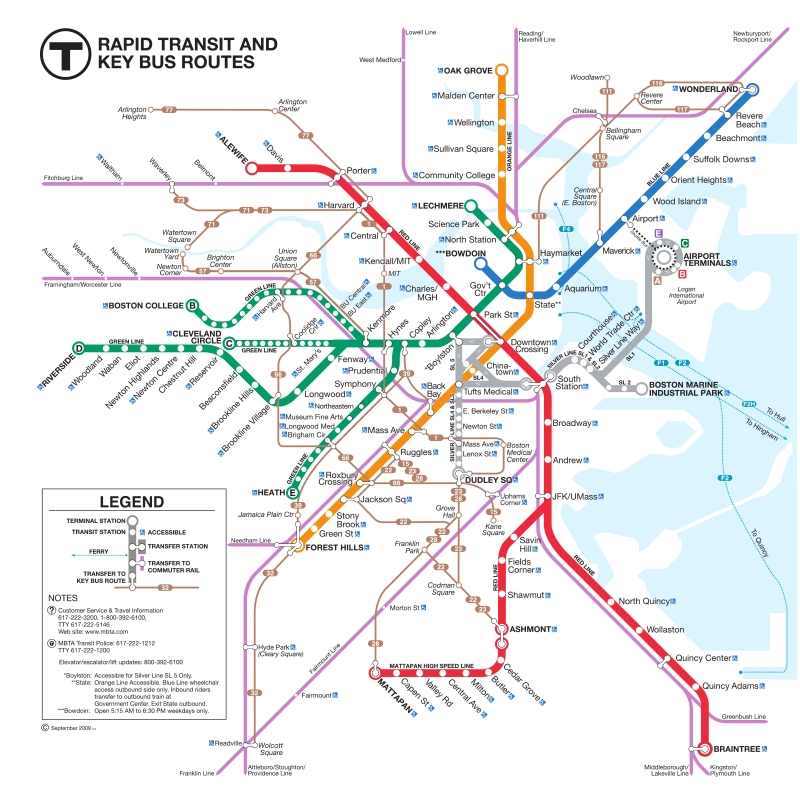
Maps that show general spatial relationships but not geography are often called diagrammatic maps, or spatializations. Spatializations are often significantly more abstract than public transit maps; the term refers to any visualization in which abstract information is converted into a visual-spatial framework (Slocum et al 2009).
Though there are many different types of maps, they share the goal of demonstrating complex spatial information in a clear and useful way. Rather than attempt to place maps into discrete categories, it is generally more productive to see them as individual entities designed to suit a particular audience, medium, and purpose. We will discuss this more in the next section.
Recommended Reading
- Chapter 1: Introduction to Thematic Mapping. Dent, Borden D., Jeffrey S. Torguson, and Thomas W. Hodler. 2009. Cartography: Thematic Map Design. 6th ed. New York: McGraw-Hill.
- Wood, D., and Fels, J. (1992) The Power of Maps. New York: Guilford.