In light of our discussion of space and place, it may seem like space is boundless, or like place is inherently small, yet this is not necessarily the case. To fully understand the complexity of these concepts, it is important to have an understanding of scale. Scale is essential to developing a spatial perspective because it enables us to organize how we think and talk about space and place.
We can begin by thinking of scale in what is probably its most familiar form: map applications like Google Maps, MapQuest, or OpenStreetMap. All of these applications allow the user to choose a point and either zoom into that point, or zoom out from it. Just to see how this works, choose whichever map application you prefer and pan the map to some part of the world that interests you.
Once you have the map centered as you like it, zoom in using the plus (+) icon. Click several times until you can’t zoom in anymore. (You may have to recenter the map to keep your point of interest on the screen.) As you zoom in, the part of the map that is visible on the screen covers a smaller area. The features—bodies of water, streets, and so on—appear larger and in greater detail. If you zoom in far enough, the outlines of buildings may appear. Now, zoom out using the minus (–) icon. Again, click several times until you can’t zoom out anymore. You will notice that the view becomes less detailed, the shapes of features like water bodies or cities lose their details and become more generalized, and some features disappear altogether.
When you zoom in or out of the map, you are changing the map’s scale. When you zoomed in and the application is displaying a smaller area with greater detail, you are looking at a large-scale map. When you zoom out and the application is displaying a greater area with less detail, you are looking at a small-scale map. We refer to this as cartographic scale, and the designations ‘large’ and ‘small’ here refer to the ratio of the area on the map to the equivalent area that it covers on the ground. A map with a scale of 1:10 would therefore be a map where one inch (or centimeter) on the map represents ten inches (or centimeters) on the ground. A map with a scale of 1:1 would have a perfect correlation (one inch on the map represents one inch on the ground). Both of these would be considered large-scale maps. A map with a scale of 1:250,000 would, by contrast, be a small-scale map. (For more on cartographic scales, see the USGS report listed in the references.)
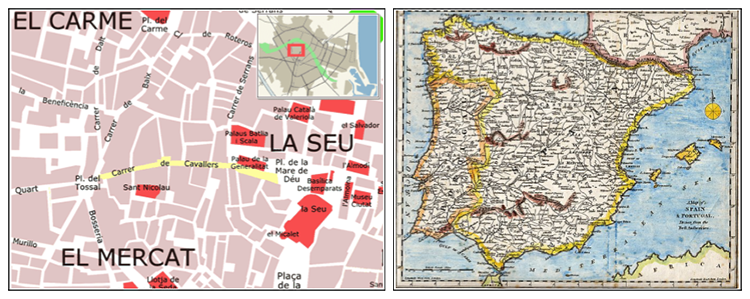
Small-scale map of Spain and Portugal Creative Commons CC0 1.0 Universal Public Domain Dedication.
Research in human geography often relies on a different rendering of scale. In this version, scale refers to the extent of the area at which phenomena happen, or the extent of the area at which we can perceive certain phenomena. We refer to this as organizational scale: a relative hierarchy of areal extents that traditionally include local, regional, national, and global scales, and may include additional designations such as the scale of the body or the extra-state regional scale.
As Herod (2009) discusses, there has been considerable debate in human geography about the nature of scale. Some argue that scale is an inherent, material property of the world, while others argue that it is purely socially constructed. Beyond this, human geographers use various metaphors of scale that reflect different theoretical orientations.
Several popular metaphors for scale include ladders, concentric circles, Russian nesting dolls, and tree roots. For our purposes, the concentric circles and tree roots metaphors will likely be the most useful. The concentric circles metaphor suggests a couple of things: first, that scales have clear boundaries; second, that things that happen at narrower scales are set within the context of things that happen at broader scales (e.g., the laws of a city in the US can be unique to that city but they have to be legal within the broader framework of the state’s legal system, which in turn have to meet certain federal standards). In this metaphor, narrower scales are contained by broader scales.
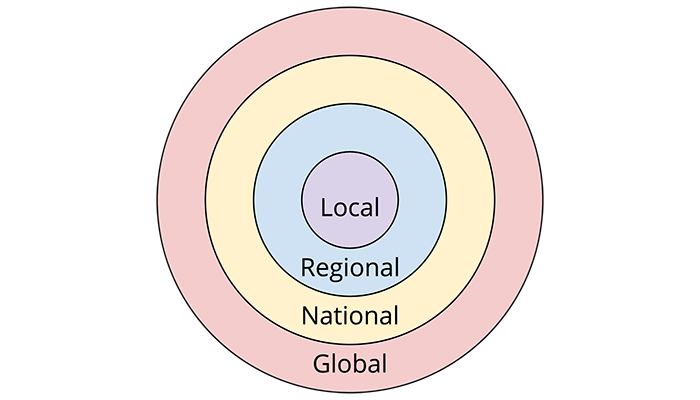
© Penn State University is licensed under CC BY-NC-SA 4.0.
By contrast, the tree root metaphor suggests that phenomena occur in relation to one another across a network of space. This metaphor is less totalizing than concentric circles imply; rather than assuming that all local-scale phenomena are subject to precisely the same external forces, it allows for some particularity: the thick bands of global influence extend downwards to smaller localities, but in some cases in different ways and with different outcomes. Likewise, this metaphor operates on the assumption that scales do not always have clear, identifiable boundaries, and indeed that they cannot always be considered as separate spaces.
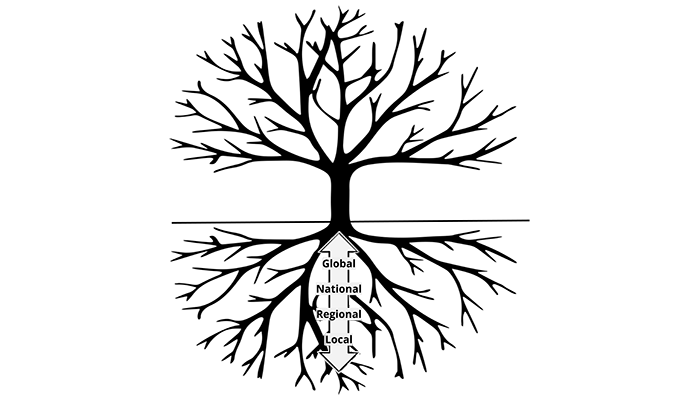
© Penn State University is licensed under CC BY-NC-SA 4.0.
The reading from Massey gets to the heart of this issue, underscoring the ways that globalization has compressed space and time, and how the technologies of our globalized world have linked distant places through flows of information, goods, and money—and changed the scale at which we think of place.
Read:
Note: Registered students can access the readings in Canvas by clicking on the Library Resources link.**
** The list of the Lesson 1 readings might not be available on the Library Resources page during the Orientation week.
References:
Herod, A. (2009). Scale: The global and the local. In N. J. Clifford, S. L. Holloway, S. P. Rice, and G. Valentine (Eds.), Key concepts in geography (2nd ed., pp. 215-235). Sage.
Marston, S. A, Jones, J. P., III, and Woodward, K. (2005). Human geography without scale. Transactions of the Institute of British Geographers, 30(4), 416-432.
U.S. Geological Survey. (2002). Map scales: U.S. Geological Survey Fact Sheet 015–02.
Available only online from the USGS.