R contains many packages that researchers around the world have created. To learn more about what is available, look through the following links.
Packages in R
R itself has a relatively modest number of capabilities grouped in the base package. Its real power comes from its extensive set of libraries, which are bundled up groups of functions called packages. However, this power comes at the cost of the fact that knowing which statistical tool is in which particular package can be confusing to new users.
During this course, you will be using many different packages. To use a package, you will first need to obtain it, install it, and then use the library() command to load it. There are two ways in which you can select and install a package.
Installing packages by command line
> install.packages("ggplot2")
> library(ggplot2)
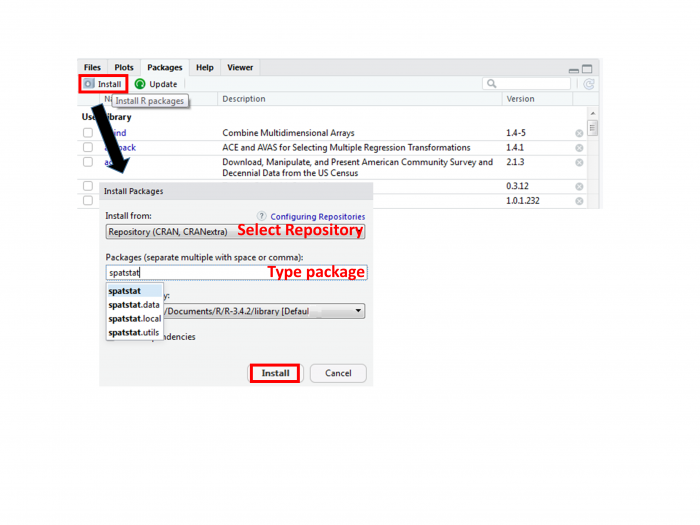
Installing packages with RStudio
Click the Packages tab and click Install (Figure 2.5). A window will pop up. Select repository to install from, and then type in the package(s) you want. To install the package(s), click Install. Once the package has been installed, you will see it listed in the packages library. To turn a package on or off, click on the box next to the package listed in the User Library on the packages tab. Some packages 'depend' on other packages, so sometimes to use one package you have to also download and install a second one. Packages are updated at different intervals, so check for updates regularly.
Troubleshooting
In some cases, a package will fail to load. You may not realize this has happened until you try to use one of the functions and an error will return saying something to the effect that function() was not found. This happens, but you should not take this as a serious error. If you run into a situation where a package fails to install, try installing it again.
If you get an error message saying something like: Error if readOGR(gisfile, layer = "stl_boundary_11", GDAL1_integert64_policy = FALSE) : could not find function "readOGR"
Then, issue the ??readOGR command in the RStudio console window and figure out which package you are missing and install (or reinstall) it.
What to install
By whatever method you choose, install the following packages. Links are provided for a few packages, providing a bit more information about the package.
Installing these packages will take a little time. Pay attention to the messages being printed in the RStudio console to make sure that things are installing correctly and that you're not getting error messages. If you get asked whether you want to install a version that needs compiling, you can say no and use the older version.
Various packages used for mapping, spatial analysis, statistics and visualizations:
- doBy
- dplyr
- ggmap (although the tmap package is relatively newer and works with the newer sf format)
- ggplot2
- gridExtra
- gstat
- leaflet: mapping elements
- spatstat
- sf (a relatively new format for R objects)
- sp
- spdep
- raster
- RColorBrewer
Additional help is available through video tutorials at LinkedInLearning.com. As a PSU student, you can access these videos. Sign in with your Penn State account, browse software, and select R.