Regression analysis is a statistical method used to estimate or predict the relationship between one or more predictor variables (also called independent variables). The independent variables are selected with the assumption that they will contribute to explaining the response variable (also called the dependent variable). In regression, there is only one dependent variable that is assumed to “depend” on one or more independent variables. Regression analysis allows the researcher to statistically test to see how well the independent variables statistically predict the dependent variable. In this week’s lesson, we will provide a broad overview of regression, its utility to predict something, and a statistical assessment of that prediction.
Learning Outcomes
At the successful completion of Lesson 5, you should be able to:
- perform descriptive statistics on data to determine if your variables meet the assumptions of regression;
- test these factors for normality;
- understand how correlation analysis can help you to understand relationships between variables;
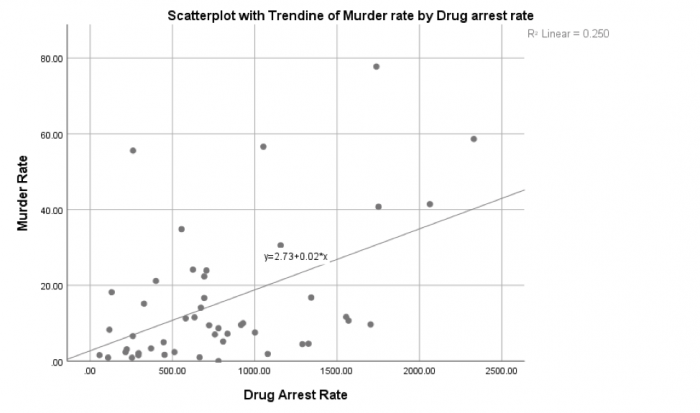
- create scatterplots to view relationships between variables;
- run a regression analysis to generate an overall model of prediction;
- interpret the output from a regression analysis; and
- test the regression model for assumptions.
Checklist
Lesson 5 is one week in length. (See the Calendar in Canvas for specific due dates.) The following items must be completed by the end of the week. You may find it useful to print this page out first so that you can follow along with the directions.
| Step | Activity | Access/Directions |
|---|---|---|
| 1 | Work through Lesson 5 | You are in Lesson 5 online content now. |
| 2 | Reading Assignment |
Read the following section of the course text:
Also read the following articles, which registered students can access via the Canvas module:
|
| 3 | Weekly Assignment | This week’s project explores conducting correlation and regression analysis in RStudio. Note that there is no formal submission for this week’s assignment. |
| 4 | Term Project | Interactive peer review: Meet with your group to receive and provide feedback on project proposals. |
| 5 | Lesson 5 Deliverables |
Lesson 5 is one week in length. (See the Calendar in Canvas for specific due dates.) The following items must be completed by the end of the week.
|
Questions?
Please use the 'Discussion - Lesson 5' discussion forum to ask for clarification on any of these concepts and ideas. Hopefully, some of your classmates will be able to help with answering your questions, and I will also provide further commentary where appropriate.