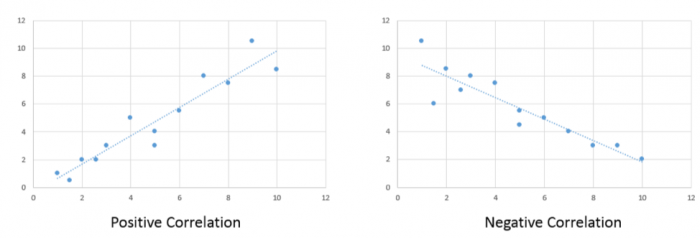
Correlation analysis quantifies the degree to which two variables vary together. If two variables are independent, then the value of one variable has no relationship to the value of the other variable. If they are correlated, then the value of one is related to the value of the other. Figure 5.1 illustrates this relationship. For example, when an increase in one variable corresponds to an increase in the other, a positive correlation results. However, when an increase in one variable leads to a decrease in the other, a negative correlation results.
A commonly used correlation measure is Pearson’s r. Pearson’s r has the following characteristics:
- Non-unit tied: allows for comparisons between variables measured using different units
- Strength of the relationship: assesses the strength of the relationship between the variables
- Direction of the relationship: provides an indication of the direction of that relationship
- Statistical measure: provides a statistical measure of that relationship
Pearson’s correlation coefficient measures the linear association between two variables and ranges between -1.0 ≤ r ≤ 1.0.
When r is near -1.0 then there is a strong linear negative association, that is, a low value for x tends to imply a high value for y.
When r = 0, there is no linear association, There may be an association, just not a linear one.
When r is near +1.0 then there is a strong positive linear association, that is, a low value of x tends to imply a low value for y.
Remember that just because you can compute a correlation between two variables, it does NOT necessarily imply that one causes the other. Social/demographic data (e.g., census data) are usually correlated with each other at some level.
Try This!
For fun: try and guess the correlation value using this correlation applet.
Interactively build a scatterplot and control the number of points and the correlation coefficient value.