
Instrumental surface temperature measurements consisting of thermometer records from land-based stations, islands, and ship-board measurements of ocean surface temperatures provide us with more than a century of reasonably good global estimates of surface temperature change. Some regions, like the Arctic and Antarctic, and large parts of South America, Africa, and Eurasia, were not very well sampled in earlier decades, but records in these regions become available as we move into the mid and late 20th century.
Temperature variations are typically measured in terms of anomalies relative to some base period. The animation below is taken from the NASA Goddard Institute for Space Studies in New York (which happens to sit just above "Tom's Diner" of Seinfeld fame), one of several scientific institutions that monitor global temperature changes. It portrays how temperatures around the globe have changed in various regions since the late 19th century. The temperature data have been averaged into 5 year blocks, and reflect variations relative to a 1950-1980 base period, i.e., warm regions are warmer than the 1950-1980 average, while cold regions are colder than the 1950-1980 average, by the magnitudes shown. You may note a number that appears in the upper right corner of the plot. That number indicates the average temperature anomaly over the entire globe at any given time, again, relative to the 1950-1980 average.
Take some time to explore the animation on your own. You may want to go through it several times, so you can start to get a sense of just how rich and complex the patterns of surface temperature variations are. Do you see periodic intervals of warming and cooling in the eastern equatorial Pacific? What might that be? [We will talk about the phenomenon in upcoming lessons].
Take note of any particularly interesting patterns in space and time that you see as you review the animation. You can turn your sound off the first few times, so you do not hear the annotation of the animation. Then, when you are ready, turn the sound on, and you can hear Michael Mann's take.
Video: Surface Temperature Patterns (1:19)
Let's look at the pattern of surface temperature changes over the past century. We are looking at surface temperatures relative to a base period from 1951 to 1980. So we're looking at whether the temperatures are warmer or colder than the average temperature over that late 20th century baseline. And we're looking at five year chunks.
We can see that in the 1930s, for example, there was some warming at high latitudes but not global in nature. We can see that in later decades, the 1960s to 1970s, there was some cooling over large parts of the Northern Hemisphere, but we'll talk about that later on in the course. That might have had in part a component due to aerosol production by human activity. And of course, as we get into the late 20th century, we see large scale warming that is unprecedented over at least the period covered by the instrumental record.
We can average over the entire globe for any given year and get a single number, the global average temperature. Here is the curve we get if we plot out that quantity. Note that in the plot below, the average temperature over the base period has been added to the anomalies, so that the estimate reflects the surface temperature of the Earth itself.
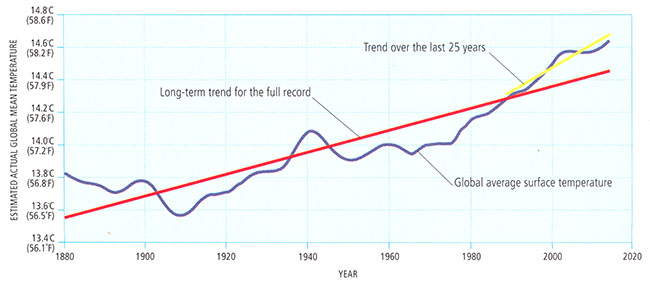
© 2015 Pearson Education, Inc.
We can see that the Earth has warmed a little less than 1°C (about 1.5 F) since widespread records became available in the mid-19th century. That this warming has taken place is essentially incontrovertible from a scientific point of view. What is the cause of this warming? That is a more difficult question, which we will address later.
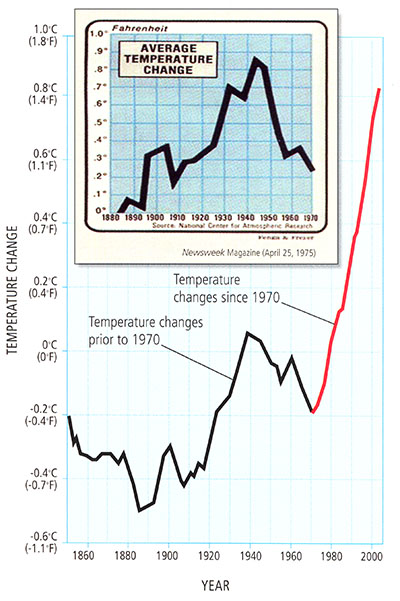
We discussed above the cooling that is evident in parts of the Northern Hemisphere (particularly over the land masses) from the 1940s-1970s. There was a time, during the mid 1970s, when some scientists thought the globe might be entering into a long-term cooling trend. There was a reason to believe that might be the case. In the absence of other factors, changes in the Earth's orbital geometry did favor the descent (albeit a very slow one!) into the next ice age. Also, the buildup of atmospheric aerosols, which, as we will explore, can have a large regional cooling impact, favored cooling. Precisely how these cooling effects would balance out against the warming impact of greenhouse gases was not known at the time.
Some critics claim that if the scientific community thought we're entering into another Ice Age in the 1970s, why should we trust the scientists to know about global warming? In fact, it was far from a scientific consensus within the scientific community in the mid 1970s that we were headed into another Ice Age. Some scientists speculated this was possible, but the prevailing viewpoint was that increasing greenhouse gas concentrations and warming would likely win out.
We know that, indeed, the short term cooling trend for the Northern Hemisphere continents ended in the 1970s, and, since then, global warming has dominated over any cooling effects.
© 2015 Pearson Education, Inc.
As mentioned earlier, we cannot deduce the cause of the observed warming solely from the fact that the globe is warming. However, we can look for possible clues. Just like forensics experts, climate scientists refer to these clues as fingerprints. It turns out that natural sources of warming give rise to different patterns of temperature change than human sources, such as increasing greenhouse gases. This is particularly true when we look at the vertical pattern of warming in the atmosphere. This is our next topic.