Prioritize...
Upon completion of this page, you should be able to discuss the basic concepts of ensemble forecasting.
Read...

Imagine you're competing in an archery contest. Would you rather shoot one arrow at a target (left target) or increase your chances of hitting the bull's eye by shooting a quiver full of arrows (right target)?
Choosing a single model of the day's output is akin to having only one "shot" at the target (in this case, the correct forecast). However, some numerical weather models are run over a variety of initial conditions, producing a variety of solutions. These ensembles represent a quiver full of arrows, all launched at the same target. For a pending forecast fraught with uncertainty, utilizing ensembles may give you a better chance of hitting the target near the center.
To get a more "meteorological" idea of what I mean, check out the schematic below. It shows the spread in the solutions of two different ensemble forecasts (one is a medium-range forecast; the other is a shorter-range forecast). In turn, this spread defines the model uncertainty for the given forecast (note that the uncertainty decreases as forecast time decreases). In most cases, the bull's eye lies somewhere within that spread. Although we can never really hope to hit the bull's eye dead center, we can at least use ensemble forecasts to make informed probabilistic forecasts that better convey the uncertainty of the situation. In archery terms, we have a better chance of hitting at least something.

So, ensembles help us to identify the signals of uncertainty associated with the forecast. Since predicted weather data always contain some level of uncertainty, it behooves us to dig a bit deeper into the theory of ensemble forecasting.
Tweaking initializations: Generating a quiver of arrows
What allows us to shoot more than one "arrow" at the target? As it turns out, the initial conditions fed into the model lie at the heart of the problem of model uncertainties (imperfect physics and parameterizations don't help either). That's because model initializations rely heavily on the previous run's forecast. Granted, these initializing forecasts are tempered by real observations, but, in the grand scheme of things, they fall short of the mark because observing stations, particularly upper-air sites, are simply too far apart over land and too infrequent. To make matters worse, in-situ upper-air observations are virtually non-existent over the vast expanse of oceans (this deficiency obviously has more impact on global models).
Needless to say, initializations are fraught with error. For example, model initializations can be quite suspect with regard to the intensity and evolution of weather features within regions of sparse observational coverage (such as the Pacific Ocean), and these can inject huge uncertainties into a pending forecast period. NCEP has taken some innovative approaches to help remedy the problem presented by large data voids, such as using targeted aircraft reconnaissance to try to observe important features over the Pacific. If you're interested, you can read more about such adaptive observations. However, regardless of these targeted efforts, initializations will never be perfect.
In some cases, initializations more accurately capture the essence of the current pattern. In general, forecasters have greater confidence making predictions in such patterns. Still, there can be relatively large uncertainties in the forecast in some regions of the country as compared to others. And, not surprisingly, those uncertainties grow with time. As an example, check out this loop of GFS ensemble forecasts of the upper air pattern based on the 00Z run on October 26, 2006. Each colored contour corresponds to an ensemble member with slightly different initial conditions. You can see little spread in the forecasts early on (great confidence), but the spread then increases with time (growing uncertainty). You can see why these types of forecasts are appropriately called spaghetti plots.
In recent decades, numerous ensemble forecast systems have been developed. The GFS is the basis of the "GEFS" (Global Ensemble Forecast System), which is also sometimes called the MREF (Medium-Range Ensemble Forecast). Other ensemble forecast systems are based on multiple models. One such system is NCEP's Short-Range Ensemble Forecast (SREF). The SREF is a 26-member ensemble run four times per day (03Z, 09Z, 15Z, and 21Z) out to 87 hours.
The Bottom Line
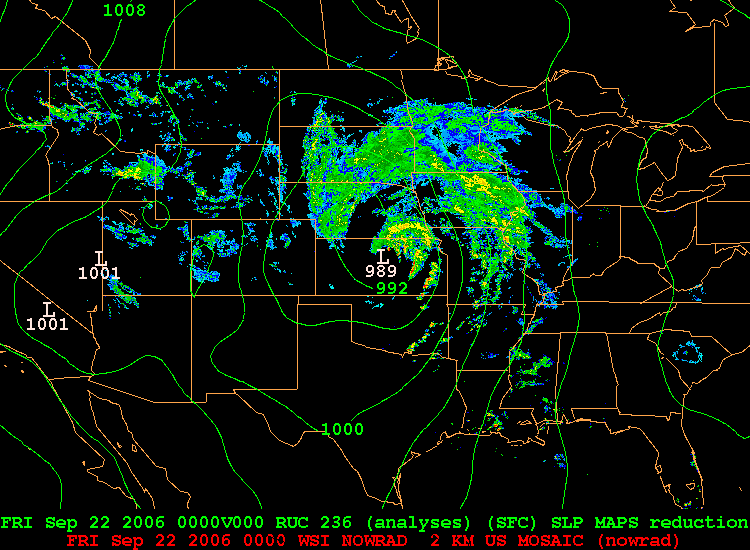
So, what does all this mean? Ultimately, the members of an ensemble represent arrows in your quiver (if you recall the metaphor we used previously). But, how do meteorologists gather relevant messages from all the ensemble members? One way is to look at the ensemble mean and the spread. For example, take a look at the image below, showing a portion of the 39-hour forecast for MSLP isobars and three-hour precipitation valid at 00Z on September 22, 2006. Not only can you see individual members, but the large panel at the bottom right of the image shows the ensemble mean (average of all the members). Here's the uncropped chart of the forecasts, if you're interested.

In certain situations, the ensemble mean has a higher statistical chance of striking the target. For example, compare the mean 39-hour ensemble mean forecast (above) with the verification chart of MSLP isobars and radar reflectivity at 00Z on September 22, 2006. Focus on the mid-latitude cyclone and its associated precipitation over the Upper Middle West. Granted, no measurable precipitation had yet fallen in northern Minnesota, but the mean 39-hour ensemble forecast from 09Z on September 20 essentially captured the tenor of the forecast over Minnesota.
But, please don't think that the mean ensemble forecast is infallible. To the contrary, it can fail miserably at times. Think about a situation in which ensemble members cluster themselves into two distinct "camps." For example, say, half of the ensemble members predict near an inch of rain to fall in a particular town, while the other half predict much less, roughly 0.10 inches (almost an "all or nothing" scenario). The mean of all those forecasts would be right in the middle... where none of the ensemble members are! In this case, the mean ensemble forecast would be a very low-confidence forecast. The lesson learned is that ensembles can give you an overall qualitative sense for the spread of the individual solutions. An assessment of the uncertainty of the model's forecast will provide insight about how useful the ensemble mean (or other statistics) might be.
Now that you know the story of how ensembles work and what their advantages are, let's use rNOMADS to retrieve some ensemble data.