As discussed in Lesson 2, crude oil is a complex mixture of hydrocarbon molecules. As engineers, we are interested in the bulk (large scale) properties of the crude oil and natural gas. As discussed earlier, these properties are typically measured in the laboratory PVT cell. A PVT cell is essentially a piston which allows the volume to be either increased or decreased. It is fitted with a pressure gauge to allow for pressures to be recorded; a measuring device to allow for the determination of the volume of the cell; and temperature control to ensure the test is conducted at the desired temperature.
For reservoirs containing black oils, the laboratory experiment used to determine PVT properties is the Differential Liberation Test. This test is illustrated in Figure 3.07.
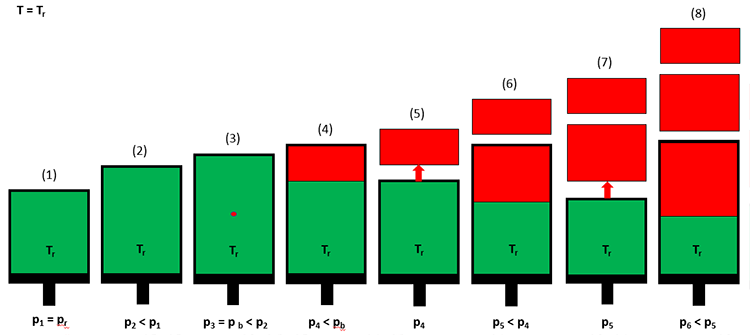
In a differential liberation test, a crude oil sample (green) is introduced into the cell at the initial reservoir pressure and temperature (Step 1 in Figure 3.07). The volume of the cell is then increased by extending the piston outward (Step 2), and the pressure and volume are recorded. At Step 2, the pressure in the cell will be less that the original pressure due to the expansion of the crude oil. This process is continued for several pressure steps until the first bubble of gas (red) is observed through a window in the cell (Step 3). This pressure is the bubble-point pressure of the crude oil. Up until the bubble-point pressure is reached, all measurements have been single-phase (liquid hydrocarbon) measurements.
After the bubble-point pressure has been reached, the volume is increased further until a significant volume of free gas has developed (Step 4). At this point, the pressure and the oil and gas volumes in the cell are measured. The gas is then expelled from the piston under isobaric (constant pressure) conditions by reducing the piston volume and allowing the gas to escape through a valve in the system (Step 5). This process is then repeated until the desired final pressure is reached (Step 8). The pressure, liquid volume, and gas volume are then used in the calculation of the appropriate properties for black oils.
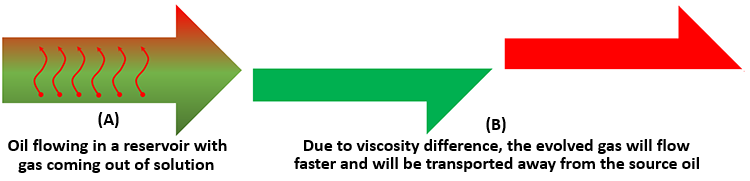
What is the differential liberation test trying to model? In the reservoir, as gas comes out of solution, it typically has a much lower viscosity than the oil phase. Consequently, as gas evolves from the oil, this difference in the viscosity allows the gas to move faster than the oil and to separate from the source oil from which it evolved. This is illustrated in Figure 3.08. In addition, due to the density differences between oil and gas phases, gravity will also act to separate the two phases. It is the properties of the separated phases that we are most interested in, as these are more representative of the processes occurring in the reservoir.
API Gravity of the Crude Oil, °API
In the oil and gas industry, crude oils are characterized by the API gravity (American Petroleum Institute gravity) of the oil. The units of the API gravity are degrees, °API (read as degrees API). The API gravity is defined as:
Where:
- ϒo is the specific gravity of the crude oil at 60 °F, dimensionless
- °API is the API gravity, degrees API
The API gravity scale acts as an inverse relationship to density (and specific gravity), that is, as density increases, the API gravity decreases. Crude oils are often graded by their API gravity:
- Light crude oil: °API > 31.5°
- Intermediate crude oil: 22.1° ≤ °API ≤ 31.5°
- Heavy crude oil: °API < 22.1o
Molecular Weight of the Crude Oil, MWo
Samples of the crude oil taken during the differential liberation test can be extracted from the PVT cell, and the compositions of the crude oil samples can be measured as functions of pressure. If the mole fractions, xi, of all components are measured from an oil sample (any sample, not just a sample from a differential liberation test), then the molecular weight in lbs/lbs-mole of the oil sample, MWo, can be calculated from:
If laboratory data are unavailable, then the Cragoe[7] correlation can be used to estimate the molecular weight:
Where:
- MWo is the molecular weight of the crude oil, lb/lb-mole
- °API is the API gravity, degrees API
Bubble-Point Pressure of the Crude Oil, pb
As already discussed, the bubble-point pressure is the pressure that first bubble of gas evolves from an undersaturated crude oil during pressure reduction. The laboratory method for calculating the bubble-point pressure, pb, of a crude oil was discussed earlier in the context of the differential liberation test. Other PVT tests, such as the Constant Composition Expansion Test, can be used to determine the bubble-point pressure of the crude oil. The constant composition expansion test is similar to the differential liberation test, however, the evolved gas is not expelled from the PVT cell during the test. For all measurements made up to and including the bubble-point pressure, the constant composition expansion test and the differential liberation test give identical results.
When measured data are not available, Standing’s correlation[8] can be used to estimate the bubble-point pressure:
with
Where:
- Rso is the solution gas-oil ratio of the crude oil, SCF/STB (to be discussed)
- ϒg is the gas gravity (MWg/MWair), dimensionless (to be discussed)
- T is the temperature, °F
- °API is the API gravity, degrees API
Solution Gas-Oil Ratio, Rso
As we have discussed, most crude oils (possibly excluding some extremely heavy crude oils: °API ≈ 10°) contain Dissolved Gas. This dissolved natural gas consists mostly of the low-end molecular weight hydrocarbons (methane, ethane, propane, and butane) and some inorganic impurities (nitrogen, carbon-dioxide, hydrogen-sulfide, etc.). The volume of this dissolved gas is quantified by the Solution Gas-Oil Ratio, Rso (sometimes simply referred to as Rs). The solution gas-oil ratio is defined as the volume of gas, measured is SCF or MSCF, in solution in 1.0 STB of crude oil. As such, it has the units of SCF/STB or MSCF/STB. A typical plot of Rso is illustrated in Figure 3.09.
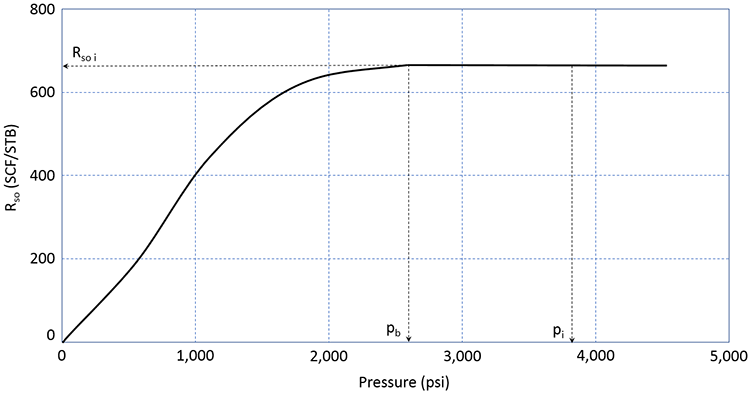
In this figure, we can see that the reservoir is an undersaturated oil reservoir. The initial reservoir pressure, pi, is greater than the bubble-point pressure. If this reservoir were to undergo pressure depletion from oil production, then the average reservoir pressure would decline over time, and the pressure would eventually reach the bubble-point pressure. During this time period, the volume of gas in solution in the crude oil remains constant at the initial value of Rso i.
Once the reservoir pressure reaches the bubble-point pressure, pb, gas begins to come out of solution. As the gas comes out of solution and evolves into Free Gas, the volume of gas remaining in solution, Rso, must decrease. This is the behavior observed in Figure 3.09. The volume of free gas liberated from the original stock tank barrel can be calculated as (Rso i – Rso) in SCF/STB or MSCF/STB.
The laboratory procedure for determining the solution gas-oil ratio was discussed in terms of the differential liberation test. The Rso values are calculated by summing the appropriate gas volumes obtained during the differential test and dividing by the final oil volume. When this is done, all volumes need to be corrected back to the reference volumes of STB and SCF to get to the appropriate Rso curve.
When laboratory derived Rso data are unavailable, then Equation 3.41 and Equation 3.42 can be used to estimate the solution gas-oil ratio. This is done by placing an assumed pressure into Equation 3.42 and using Equation 3.41 to calculate the pressure associated with that assumed Rso value (not the bubble-point pressure as explicitly written in the equation).
Oil Formation Volume Factor, Bo
The Oil Formation Volume Factor, Bo, is comparable to the water formation volume factor. It relates volume of 1.0 STB of crude oil at stock tank conditions, pST and TST, to its volume at reservoir conditions, pr and Tr. A typical plot of Bo is illustrated in Figure 3.10.
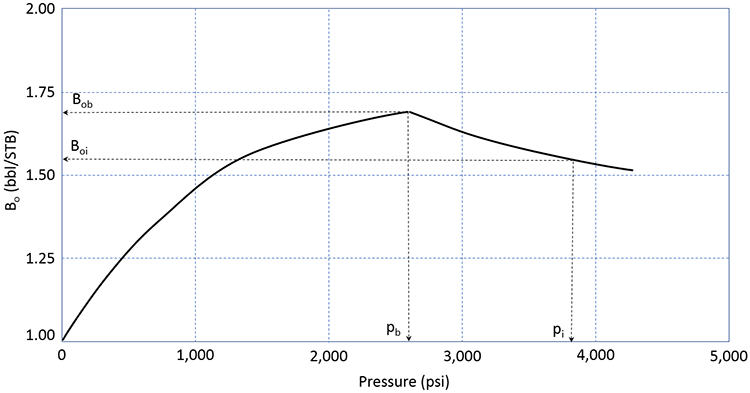
This figure shows the formation volume factor of the crude oil for the same reservoir as that shown in Figure 3.09 (identical pi and pb). As the pressure depletes from the initial pressure to the bubble-point pressure, the formation volume factor increases. This is indicative of the crude oil expanding (remember, the formation volume factor is based on 1.0 STB of oil – when the FVF increases, it is because the volume in reservoir barrels, bbl, of that STB is getting larger). This is the typical behavior that would be expected by a slightly compressible fluid - as confining pressure is reduced, we would expect that the volume would expand.
When the reservoir pressure reaches the bubble-point pressure, the formation volume factor begins to decrease. This is indicative of the crude oil shrinking. This is the opposite of the expected behavior of a slightly compressible fluid. This implies that as confining pressure is reduced the volume of the crude oil gets smaller. The reason for this behavior is that the crude oil is composed of the liquid hydrocarbon and the gas dissolved in it. As the gas comes out of solution, the crude oil loses the volume occupied by the solution gas.
Oil FVF above the Bubble-Point Pressure Pressure, p > pb
Because the formation volume factor of crude oil behaves differently above and below the bubble-point pressure, we must use correlations that show the proper trends. Since the crude oil behaves as a typical slightly compressible fluid above the bubble-point pressure, we can use the definition of compressibility, Equation 3.32, above the bubble-point pressure:
and
Where, for crude oils, we use pb as the reference pressure.
Oil FVF below the Bubble-Point Pressure, p < pb
Below the bubble-point pressure, we can use Standing’s correlation[8] to estimate the oil phase formation volume factor:
with
Where:
- Bo is the oil formation volume factor, bbl/STB
- Rso is the solution gas-oil ratio of the crude oil, SCF/STB
- ϒg is the gas gravity (MWg/MWair), dimensionless (to be discussed)
- ϒo is the oil specific gravity (ρo/ρw), dimensionless
- T is the temperature, °F
These equations are valid below and up to and including the bubble-point pressure. Therefore, we can use these equations to generate Bob for Equation 3.43b if it is unavailable from laboratory measurements.
Oil Phase Compressibility above the Bubble-Point Pressure, p > pb
As discussed, above the bubble-point pressure, crude oil acts like a slightly compressible fluid. One correlation for oil phase compressibility, co, above the bubble-point pressure from Vazquez and Beggs[9] is:
Where:
- co is the oil compressibility, 1/psi
- Rso is the solution gas-oil ratio of the crude oil (for p > pb; Rso = Rso i), SCF/STB
- T is the temperature, °F
- ϒg is the gas gravity (MWg/MWair), dimensionless (to be discussed)
- °API is the API gravity, degrees API
- p is the pressure, psi
Oil Phase Compressibility below the Bubble-Point Pressure, p ≤ pb.
Crude oil above the bubble-point pressure can contain large amounts of dissolved solution gas (high values of Rso). At higher Rso values, the crude oil has higher compressibility values due to the solution gas. At pressures below the bubble-point pressure, gas comes out of solution and the compressibility values begin to get smaller as the crude oil tends to behave more and more like a Dead Oil (dead oil is gas free oil; while crude oil with dissolved gas is often referred to as Live Oil). One common correlation for oil phase compressibility, co, below the bubble-point pressure from McCain, Rollins, and Villena[10] is:
Equation 3.46b
Where:
- co is the oil compressibility, 1/psi
- p is the pressure, psi
- T is the temperature, °F
- °API is the API gravity, degrees API
- Rso b is the solution gas-oil ratio of the crude oil at pb (Rso b = Rso i), SCF/STB
Oil Phase Density above the Bubble-Point Pressure, p > pb
One the values of pb, Rso, ϒg, Bo, and co are determined (either by laboratory measurements or by correlations), the oil phase density itself is specified (there are degrees of freedom remaining for ρo). As we discussed earlier, above the bubble-point pressure, crude oil behaves like a slightly compressible fluid. As such, we can use the definition of compressibility based on density:
Now, if we assume 1.0 STB of oil, at reservoir conditions, then we have:
and
Substituting Equation 3.48 into Equation 3.47 results in:
After integration of Equation 3.49 we have:
Oil Phase Density below the Bubble-Point Pressure, p ≤ pb
Below the bubble-point pressure, the crude oil loses mass (mass of the liberated gas), so we must account for the mass of the liquid oil and the mass of the gas remaining in solution when estimating the oil density below the bubble-point pressure. We can do this with a simple material balance. Below (and up to) the bubble-point pressure, the density of the crude oil can be calculated by dividing the total mass of the oil plus dissolved gas by the total volume. In terms of the properties discussed so far, we have:
Where:
- ρo is the oil density, lb/ft3
- ρo ST is the density of the dead oil (gas free oil) at stock tank conditions, lb/ft3
- ϒg is the gas gravity (MWg/MWair), dimensionless (to be discussed)
- Rso is the solution gas-oil ratio of the crude oil at pr and Tr, SCF/STB
- Bo is the oil phase formation volume factor at pr and Tr, bbl/STB
Note that we can use the properties in at the bubble-point pressure, Rso i and Bob, in Equation 3.51 to obtain ρob for input into Equation 3.50.
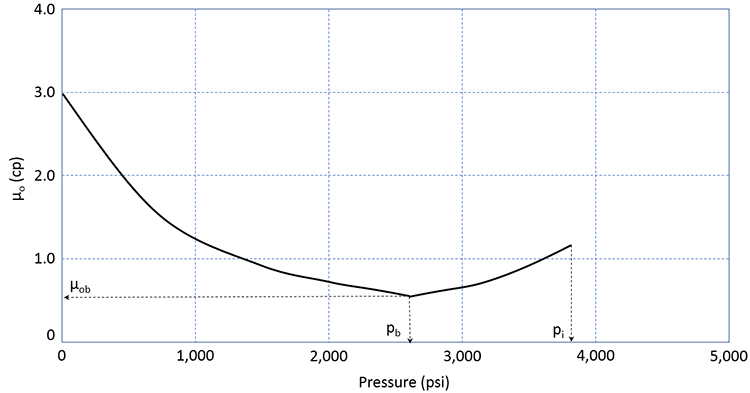
Oil Phase Viscosity above the Bubble-Point Pressure, p > pb
The viscosity of a crude oil is also impacted by the amount of gas in solution. The typical viscosity behavior of crude oil is shown in Figure 3.11.
Oil Phase Viscosity below the Bubble-Point Pressure, p ≤ pb
The estimation of the oil viscosity below the bubble-point pressure is a two-step process. In the first step, the dead oil (gas free) viscosity is calculated and in the second step the live oil (oil with solution gas) viscosity is calculated. The dead oil viscosity at reservoir temperature can be calculate by[11]:
The second step is to calculate the live oil viscosity with the dissolved gas:
with
and
Where:
- A and B are correlation parameters
- μoD is the dead oil at Tr, cp
- °API is the API gravity, degrees API
- T is the temperature, °F
- Rso is the solution gas-oil ratio of the crude oil at pr and Tr, SCF/STB
Oil Phase Viscosity above the Bubble-Point Pressure, p > pb
The oil viscosity above the bubble-point pressure can found by calculating the viscosity at the bubble-point pressure, μob and Rso i, and adjusting it to higher pressures[11]:
with
Where:
- C is a correlation parameter
- μob is the live oil viscosity at pb and Tr, cp
- p is the pressure of interest, psi
- pb is the bubble-point pressure, psi
[7] Cragoe, C.S.: “Thermodynamic Properties of Petroleum Products,” U.S. Dept. of Commerce, Washington, DC (1929) 97.
[8] Standing, M.B.: Volumetric and Phase Behavior of Oil Field Hydrocarbon Systems, SPE, Richardson, TX (1977) 124.
[9] Vazquez, M. and Beggs, H.D.: "Correlations for Fluid Physical Property Prediction," JPT (June 1980) 968-70.
[10] McCain, W.D. Jr., Rollins, J.B., and Villena, A.J.: "The Coefficient of Isothermal Compressibility of Black Oils at Pressures Below the Bubblepoint," SPEFE (Sept. 1988) 659-62; Trans., AIME, 285. 10.
[11] W.D. McCain .Jr. “Reservoir·Fluid Property Correlations-State of the Art,” SPE Reservoir Engineering, (May 1991) p. 266.