We can also use the Tubing Performance Curves and Inflow Performance Curves to aid in other decisions concerning the well design. When we complete a well, we may want to consider stimulating the well or applying artificial lift in the original completion design.
We briefly discussed well stimulation when we were discussing the skin factor, in Lesson 4 and Lesson 5. In these lessons, we saw that the skin factor is part of the definition of the productivity index, (see Table 7.01 and Table 7.02) and is positive for damage and negative for stimulation.
We will use two simple models of skin to illustrate its use when considering well stimulation in the completion design. These two simple skin models are:
and
Where:
- is the skin factor, dimensionless
- is the hydraulic fracture length, ft
- is the well radius, ft
- is the permeability of the reservoir, md
- is the permeability of the stimulated zone, md
- is the radius of the stimulated zone, ft
These two skin models are based on different idealizations of reservoir/well system which are shown in Figure 7.23.
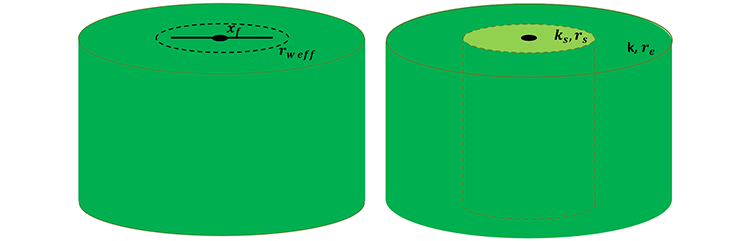
Equation 7.05 uses the idealization of the fracture half-length, as an effective wellbore radius. This idealization is valid if the flow patterns in the reservoir are approximately radial away from the fracture. It is observed that typically after some time period, the flow patterns do establish themselves as radial. You can substitute this definition of skin into any of the inflow performance relationships in Table 7.01 or Table 7.02, perform some algebra, and see that the fracture half-length takes the place of the well radius in a well if there is no other skin in that well.
This definition of skin is applicable for the simple modeling of hydraulically fractured vertical wells. Obviously, this simple description of skin would not be applicable for very complex completions such as that shown in Figure 7.01 with multiple fracture stages. For simple completion designs, we can analyze hydraulic fracture treatments with different fracture lengths to determine the optimal fracture length for our well.
Equation 7.06 defines a skin facture in an equivalent, homogeneous drainage area (single-zone reservoir) that would give the same IPR (rate – drawdown pressure relationship) as our actual composite reservoir (two-zone reservoir). In an acid matrix stimulation treatment in formations susceptible to acid (such as carbonate reservoirs – limestones and dolomites), when we acidize the well, the acid travels out radially from the well increasing the permeability as it reacts with the formation. At some point, typically several inches away from the well, the acid is spent and no longer has any impact on the permeability. Therefore, if we start off with a homogeneous reservoir and inject acid into a susceptible formation, then we would create a composite reservoir similar to the one shown in Figure 7.22 (B). Equation 7.06 is called the Hawkins formula.
Note from Equation 7.06 that if we are increasing the permeability, then the skin factor is negative, signifying stimulation. Therefore, we can use this model of skin to analyze acid treatments with acid types and acid volumes (effective ) to determine the optimal acid treatment for our well.
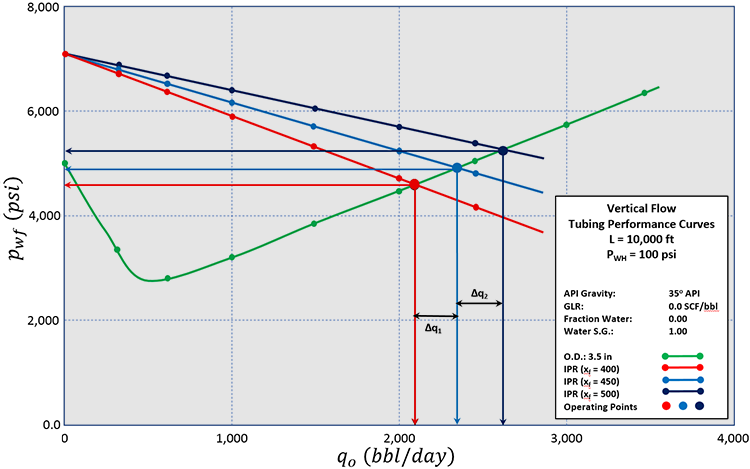
Once we select the optimal tubing size, then we can use the effective skin factors from Equation 7.05 or Equation 7.06 in the IPR equation to perform our IPR-TPC analyses. This may take several iterations if the stimulation treatment design impacts the choice for the optimal tubing size. A typical IPR-TPC Analysis for different stimulation treatments (effective skin values), is shown in Figure 7.23. The payback time for the stimulation treatments can also be determined from Equation 7.04.