Additional reading from www.astronomynotes.com
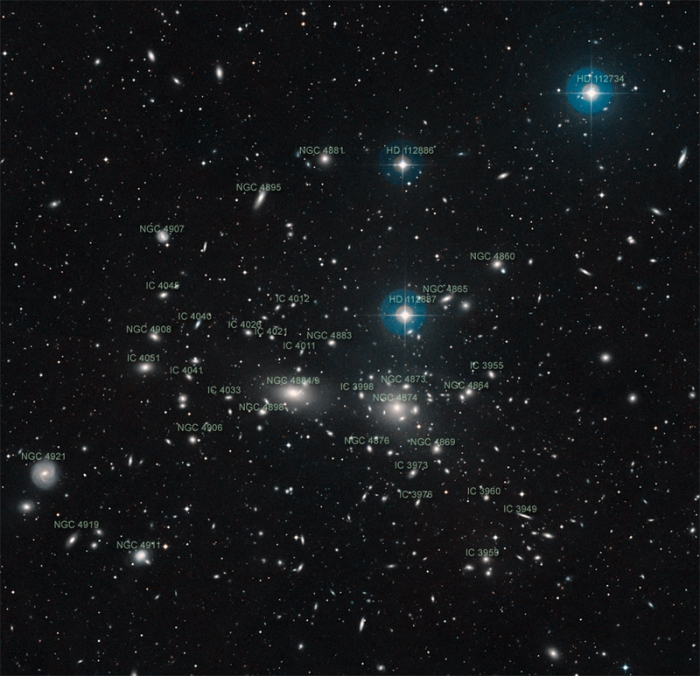
Using the power of Hubble's Law to measure the distances to large numbers of galaxies, we can investigate the distribution of these objects in the Universe. So far, we have only looked at a few nearby examples: the Local Group and the Virgo Cluster. The Local Group is surrounded by a few other groups that we have discussed, and the Virgo Cluster is only one of a few nearby clusters. What we find when we study the distribution of galaxies in more detail is that groups and clusters are common throughout the Universe. For example, the Coma Cluster is another galaxy cluster, but it is different from Virgo in that it is a very massive, very dense cluster that contains about 10,000 galaxies.

The Perseus Cluster is another large cluster of galaxies within 100 Mpc of the Milky Way. You can find a large number of additional images of galaxy clusters at APOD or at Hubblesite. However, most of them look similar to the images you have seen so far of Virgo, Coma, and Perseus.
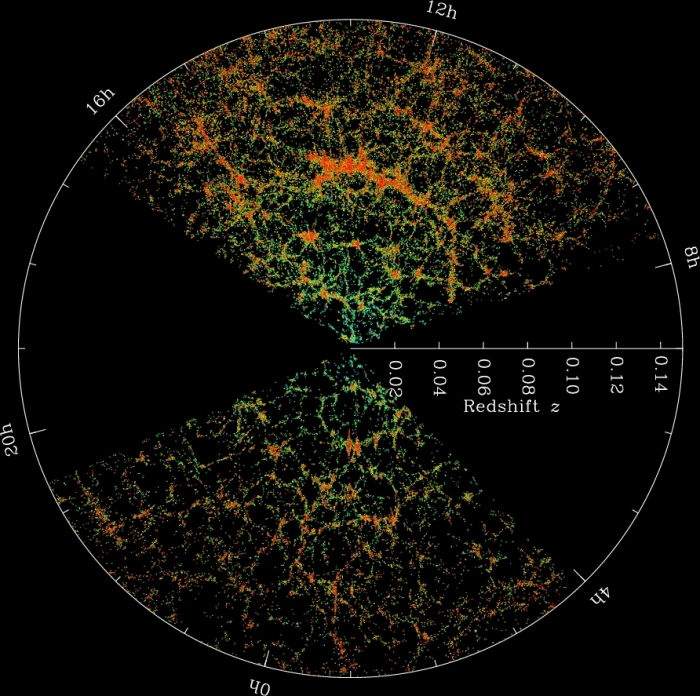
Since we now know that the redshift of a galaxy is a measurement of its distance, after we take an image of a part of the sky, we can take spectra of all of the galaxies in that image to determine their distances. What we have found is that galaxies tend to clump together. Astronomers have invested a lot of effort in doing this not just in deep fields, but in large swaths of sky. In this way, we have not only mapped out the distances to the clusters themselves, but to the galaxies in front of, behind, and around these clusters. So, what do we find? Well, for example, look at the plot below of the distances to a large number of galaxies from the Sloan Digital Sky Survey.

To interpret the plot above, picture it as a slice of the sky as seen from Earth. So Earth is at the center of the image. Each point on the plot is a galaxy. The direction to that point indicates its location on the sky, and the distance from the center of the image indicates its distance from Earth. Another group completed a similar survey of the galaxies in the Universe called the 2dF Redshift Survey.
These pie slice diagrams show the distances to all of the galaxies in a narrow strip of sky. The densest groups of points are the locations of clusters like Virgo, Coma, and Perseus. What you should notice is that the distribution of galaxies is not random. That is, the clusters appear to form clusters of clusters! The structure that you see in the pie slice diagrams is often described as being like soap bubbles. That is, the galaxies lie along the walls of the bubbles, and inside the bubbles are voids where very few galaxies are found. The voids are not completely empty. For example, the Hubble Deep Field image was taken in the center of a void. The poor groups like the Local Group lie in the voids.
The Cosmological Principle
So far, we have been considering cosmology mainly from an observational standpoint. That is, we have been looking at the distribution of galaxies in the Universe and the relationship between their distances and their velocities. However, we can also consider cosmology from a theoretical standpoint. That is, given what we know about the laws of physics, how should the Universe behave? In the early part of the 20th century, scientists like Einstein were using the theory of General Relativity to describe the behavior of the Universe. Astronomers studying the Universe made a simplifying assumption that is now known as the Cosmological Principle. It states:
- On the largest cosmic scales, the Universe is both homogeneous and isotropic.
Homogeneity means that there is no preferred location in the Universe. That is, no matter where you are in the Universe, if you look at the Universe, it will look the same.
Isotropy means that there is no preferred direction in the Universe. That is, from your current location, no matter which direction you look, the Universe will look the same.
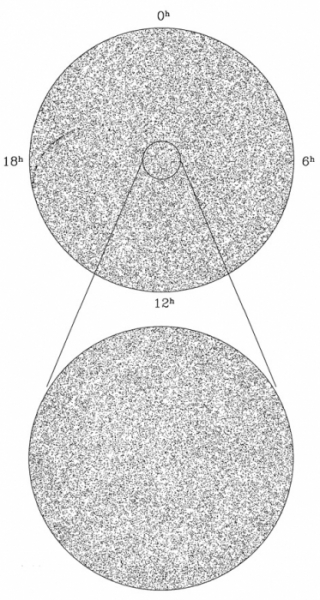
Diagrams like the one above of the distribution of galaxies in the Universe seem to imply that the Universe isn't homogeneous and isotropic. In other words, the galaxies in one direction are not distributed in exactly the same way as the galaxies in another direction. However, if you look at the scale on the plot, the galaxies it contains only extend to a redshift of z < 0.2, which is equivalent to a distance of about 750 Mpc. When we study the most distant objects we can find at much larger distances from Earth, the structure appears to smooth out and become more homogeneous on the largest scales. For example, the all-sky map of the locations of objects detected by radio telescopes shown below reveals a much more uniform appearance. These objects are mostly expected to lie at higher redshifts than the ones in the pie slice diagram above, suggesting that when we consider the largest distance scales, the Universe appears to be homogeneous and isotropic. Thus, we currently find support for the Cosmological Principle in the distribution of galaxies in the Universe.
