Learning Check Point: Compare Cities
Background: World Bank Study – Ranking coastal cities according to the risk of coastal flooding.
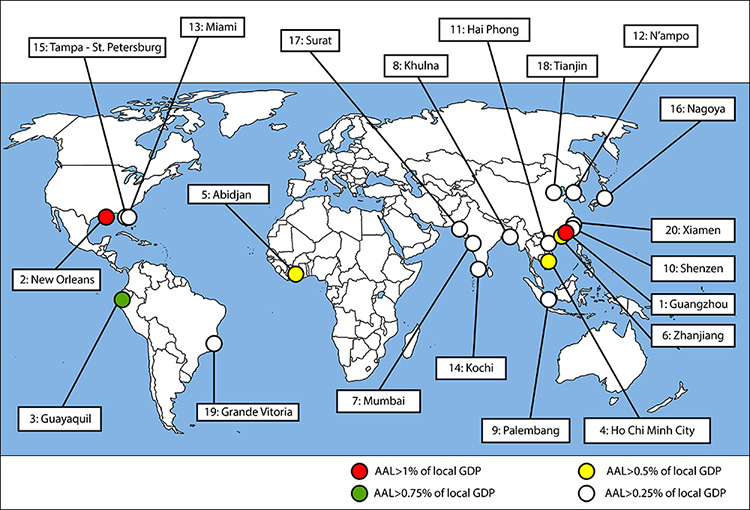
In the report published in the journal Nature Climate Change in 2013, authors from the World Bank and other institutions created a ranking system for vulnerability of coastal cities around the world. In the report, the authors “provide a quantification of present and future flood losses in the 136 largest coastal cities”. (Hallegatte et al, 2013).
The measure used for ranking is Average Annual Loss (caused by flooding). If the Gross Domestic Product (GDP), a measure of the wealth of the community, is factored in, this changes the ranking as a greater proportion of the GDP of poorer communities is likely to be affected by a flooding event. This causes poorer communities to rank higher when the GDP is included in the calculation. It is a known fact that the poor are disproportionally impacted by a catastrophic event such as a flood, as they have less capacity for recovery.
Several factors must be taken into account to calculate a city's vulnerability and to project this vulnerability into the future - see below (those cities with lower country GDP have greater % of GDP affected by flood loss):
- the wealth of the city's country (GDP);
- relative sea level rise in the area;
- population and population growth trends;
- property values;
- flood protection measures;
- storm frequency in the area.
These factors will be studied in more detail later in the course. In this module, we will explore some of the data from the above-referenced report and take a look at the cities that rank in the top 10 of the 136 cities at risk of coastal flooding.
In Module 1 Lab, you will use Google Earth to “travel” to at least two of these cities to learn what makes them vulnerable.
Activity: Compare Cities - World Bank Study – Ranking of coastal cities' vulnerability to coastal flooding.
To prepare for the Module 1 assessments, read through "Which Coastal Cities Are at Highest Risk of Damaging Floods? New Study Crunches the Numbers" The World Bank, August 19, 2013.
| List A - City - Overall Cost (Average Annual Loss) | AAL (US$ Million) | List B - City - AAL as of % of City GDP | AAL as % of GDP |
|---|---|---|---|
| 1. Guangzhou, China | 687 | 1.Guangzhou, China | 1.32 |
| 2. Miami, USA | 672 | 2. New Orleans, USA | 1.21 |
| 3. New York, USA | 628 | 3. Guayaquil, Ecuador | .95 |
| 4. New Orleans, USA | 507 | 4. Ho Chi Min City, Vietnam | .74 |
| 5. Mumbai, India | 284 | 5. Abidjan, Ivory Coast | .72 |
| 6. Nagoya, Japan | 260 | 6. Zhanjiang, China | .50 |
| 7. Tampa, USA | 244 | 7. Mumbai, India | .47 |
| 8. Boston, USA | 237 | 8. Khulna, Bangladesh | .43 |
| 9. Shenzhen, China | 169 | 9. Palembang, Indonesia | .39 |
| 10. Osaka, Japan | 120 | 10. Shenzhen, China | .38 |
In List A, the top four cities alone (3 of which are in the US) account for 43% of the forecast total global losses. Highlighted in red are the cities that appear on both lists.
Please take a moment to compare lists A and B in Table 1.1 above. When you are ready, answer the questions in the Learning Checkpoint below.
Note: There is no credit for this activity, but you are expected to understand the principles (i.e., don't learn the ranking or the data) for assessments.