Practical Mapping: What about the data?
Considering the characteristics of the geographic phenomena you wish to map will inevitably improve the quality of your maps. However, before you design your map, you must understand the distinction between the characteristics of the phenomena and those of your data.
Consider again the map from Figure 3.1.1.
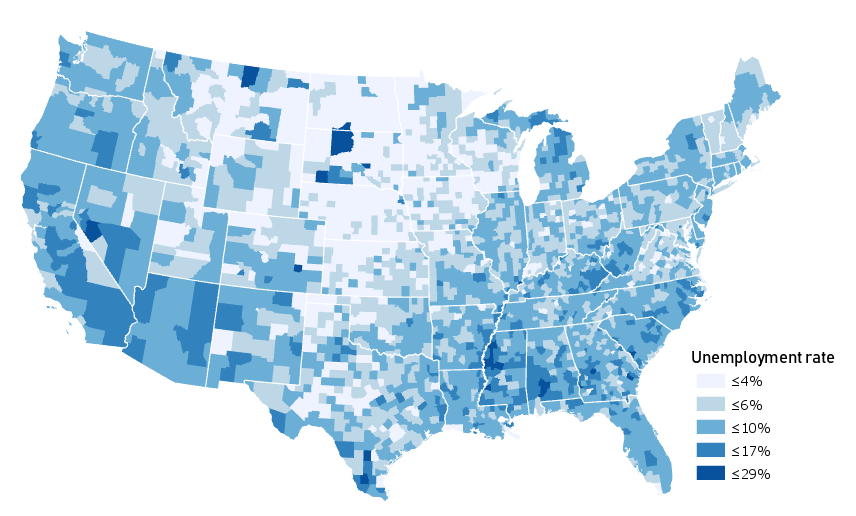
This map illustrates unemployment rates in the US at the county level. Though it is a well-designed and attractive map, consider the characteristics of unemployment as a geographic phenomenon. The abrupt change in unemployment rates at county boundaries in this map obscures the underlying heterogeneity in unemployment within county bounds. The phenomenon of unemployment varies by person, while the mapped unemployment data varies by county. This doesn’t mean the map is wrong, but it is a reality important to be cognizant of, both while creating your own maps and while critiquing those designed by others.
Relatedly, when creating maps, you will often rely on data that has already been collected by others. Often, this data is collected (as in the example in Figure 3.1.1 above) by enumeration units, such as counties, census tracts, or states. Unemployment does vary by person, but it is unlikely that this fine-grained data will be available to you. If you have somewhat coarse (e.g., state level) data, you cannot create a map that shows variation by person, by county, etc., even if this would be a more accurate depiction of the phenomena. The only way to create a more detailed map is to collect more granular data. Your map design can always be altered to present a simplified depiction of your data—but not the other way around.
Recommended Reading
Slingsby, Aidan, Jason Dykes, and Jo Wood. 2011. “Exploring Uncertainty in Geodemographics with Interactive Graphics.” IEEE Transactions on Visualization and Computer Graphics. doi:10.1109/TVCG.2011.197.