Required Reading:
Before we go any further, you need to read the following text, which is available through the Library Resources tab in Canvas:
- Chapter 10: GIS - Fundamentals: A First Text On Geographic Information Systems by Paul Bolstad, 2005
Map algebra is a framework for thinking about analytical operations applied to field data. It is most readily understood in the case of field data that are stored as a grid of values but is, in principle, applicable to any type of field data.
The map algebra framework was devised by Dana Tomlin and is presented in his 1990 book Geographical Information Systems and Cartographic Modeling (Prentice Hall: Englewood Cliffs, NJ), which you should consult for a more detailed treatment than is given here. Another good reference on map algebra (and much else besides) is GIS Modeling in Raster (Wiley: New York, 2001) by Michael DeMers.
Many GIS (including Esri’s ArcGIS) support map algebra. In ArcGIS, the tool most closely related to map algebra is called the ‘raster calculator'.
Basic concepts
The fundamental concepts in map algebra are the same as those in mathematical algebra, that is:
- Values are the 'things' on which the algebra operates. Input data and output data (results) are presented as grids of values. Values can be categorical (nominal or ordinal) or numerical.
- Operators may be applied to single values to transform them, or between two or more values to produce a new value. In mathematical algebra, the minus sign '-' is an operator that negates a single value when placed in front of it, as in -5. The plus sign '+' is also an operator, signifying the addition operation, which, when applied between two values, produces a new value: 1 + 2 = 3
- Functions are more complex, but still well defined, operations that produce a new output value from a set of input values. The input set may be a single value, as in , or a set of values, as in .
To apply an operation or function to these values, there are many different ways to proceed that range in complexity from simple to advanced and from local to global operations.
Below are examples of local, focal, zonal, and global operations and how they work when evaluating cells. Each of the operation types differs in how much of the cell’s neighborhood is used by the operator or in the operation.
| Local | A local operation or function in map algebra is applied to each individual cell value in isolation. |
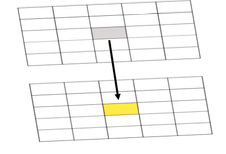
Figure 7.1. Result of a local operation/function
Credit: Blanford, © Penn State University, licensed under CC BY-NC-SA 4.0
|
This means that the value at each location in the output grid is arrived at by evaluating only values at the location of each individual cell. |
|---|---|---|---|
| Focal | Uses a user-defined neighborhood surrounding a cell (often 3 x 3 but other neighborhood sizes and shapes are also possible) in the map algebra operation. |
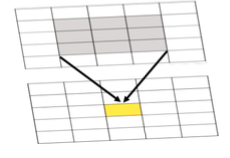
Figure 7.2 Result of the focal max. The result at each location in the output grid is determined by combining values focused at the corresponding location in the input grid or grids, as shown by the shading.
Credit: Blanford, © Penn State University, licensed under CC BY-NC-SA 4.0
|
Many functions can be applied focally in this way, such as maximum, minimum, mean (or average), median, standard deviation, and so on. A different choice of focal neighborhood will alter the output grid that results when a focal function is applied. |
| Zonal | Is applied to a set of map zones (e.g., counties, Congressional Districts, etc.). |
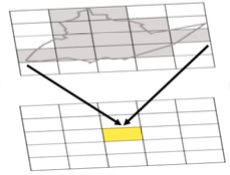
Figure 7.3 Example of a zonal operation where the result at each location in the output grid is determined from the set of values in the zone that the cell falls within as shown by the shading.
Credit: Blanford, © Penn State University, licensed under CC BY-NC-SA 4.0
|
Zonal operations and functions are an extension of the focal concept. Rather than define operations with respect to each grid cell, a set of map zones is defined (for example, counties), and operations or functions are applied with respect to these zones. |
| Global | Values at each grid cell in an output grid may potentially depend on the values at all grid cell locations in the input grid(s). |
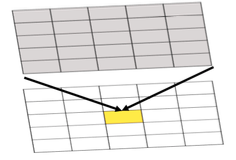
Figure 7.4 Example of a global operation where the result at each location in the output grid is determined from the set of values at that location and other locations in the input grid, as shown by the shading.
Credit: Blanford, © Penn State University, licensed under CC BY-NC-SA 4.0
|
Global operations and functions include operations that find the cost (in time or money) of the shortest path from a specified location (e.g., the yellow cell in the figure) to every other location. Such operations may have to take into account values at all locations in a grid to find the correct answer. |