Estimating the school-aged population in each of your new school districts
Given the representativePopInSchoolDistricts and CentreCountyBGDemographics layers, the next task is to estimate how many children are in each school district, as a preliminary step before deciding where a new school would be most useful.
There are many different ways that you could tackle this task.
Some of them involve raster operations (recall the approaches used in the Texas redistricting example in Lesson 3), and the Spatial Analyst Tools - Zonal - Zonal Statistics tool. But before you can use these, you would have to construct a raster representation of the school-aged population. Again, consider how this was done in the Texas example.
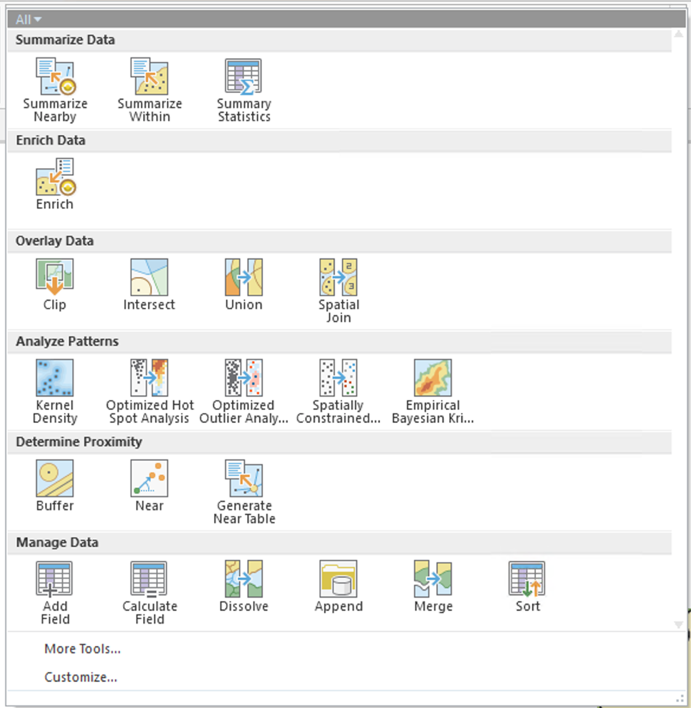
A more straightforward approach will use Analysis - Summarize Within (Figure 7.11), a Spatial Join (Analysis - Spatial Join, Figure 7.11), or Analysis Tools - Overlay - Spatial Join from the Tools menu.
In analysis like this, there is no 'right' or 'wrong' way, just what works, so here's the deliverable - you figure out how to get there. Do this step for both the original districts and the road-cost-weighted districts.
Deliverable
For your Project 7 write-up, include these estimates and explain how you went about determining the number of the school-aged children in the four school districts.