We saw the family of past and possible future trajectories of greenhouse gas emissions and concentrations earlier in the course. But what are the specific greenhouse gases involved, other than the obvious culprit - CO2, and where are these emissions actually coming from? What are the sectors of society and economy responsible for these emissions, the potential for reducing emissions in these various sectors, and the larger economic, political, and ethical considerations surrounding these issues?
First, let us tackle the first question. What are the anthropogenic greenhouse gas emissions in the first place? Indeed, the main culprit is, as we might have expected, CO2. In terms of the net increase in the greenhouse effect due to human-produced greenhouse gases, CO2 is responsible for the lion's share. CO2 from fossil fuel burning alone is more than half the net force. If you add CO2 from fossil fuel burning, deforestation, and other minor sources, this comes to a little more than three-fourths of the net greenhouse radiative forcing by human-caused emissions. That means, however, that a non-trivial fraction of the effect is coming from other gases. What are they?
Well, roughly 14% is methane, mostly from agriculture, livestock raising, and damming projects (which create an artificial breeding ground for methanogenic bacteria), though some also escapes during natural gas recovery attempts. Another 8% is nitrous oxide—also a byproduct of agriculture, and the remaining 1.1% is chlorofluorocarbons (CFCs). It is tempting to simply lump the contribution of these greenhouse gases together with that of CO2, representing the net impact in terms of an effective CO2 concentration called "CO2 equivalent" as we saw briefly earlier in the course. There is a catch, however! Some of these gases (like methane) are considerably more short-lived in the atmosphere than CO2, persisting for decades rather than centuries. Such complications are often dealt with through the concept of global warming potential (GWP), which takes into account both the radiative properties of a particular greenhouse gas molecule and the lifetime that such a molecule typically has in the atmosphere, once emitted. In any case, such details represent a complication for greenhouse emissions mitigation policies. If we need to avoid a dangerous near-term climate tipping point, we might focus more effort on reducing methane because it is a particularly potent, if short-lived, greenhouse gas. On the other hand, if our goal is to stabilize long-term greenhouse gas concentrations, we would be better served by focusing purely on CO2 emissions.
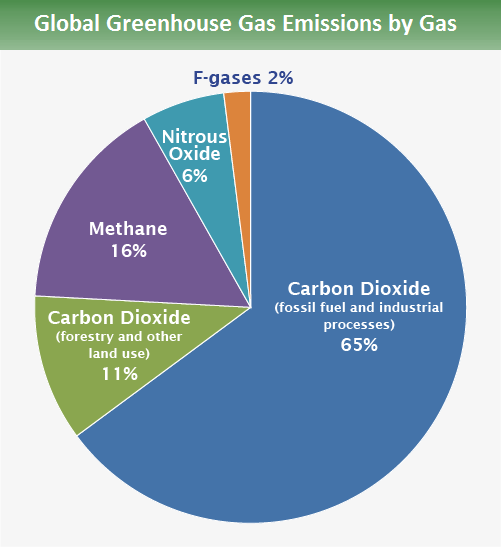
- Carbon dioxide/CO2 fossil-fuel use: 65%
- Carbon dioxide/CO2 (deforestation, decay of biomass, etc.): 11%
- Methane/CH4: 16%
- Nitrous Oxide/N2O: 6%
- CFCs/F-gases: 2%
So, where are these greenhouse gas emissions coming from? They come from literally every sector of our economy. The largest single source is energy supply—primarily coal-fired power plants, and natural gas—used by consumers for electricity and heating. The next largest contribution comes from industry, which includes electricity and heating used by the industrial sector and greenhouse gases released as a byproduct of cement production, chemical processing, and other industrial processes. Energy supply and industry combine for nearly half of the greenhouse gas emissions. Next, accounting for about 17% of emissions, is forestry—mostly the carbon released from forest clearing and forest burning, followed by agriculture and transport, each of which accounts for around 13% of emissions. Agricultural emissions are mostly in the form of methane released by ruminants such as cows used as livestock, and by cultivation of rice paddies, which provide breeding grounds for methanogenic bacteria. Transport-related emissions are mostly in the form of petroleum-based fuels used for personal (i.e., cars and motorcycles, minivans, SUVs, small trucks, buses, airplanes) and commercial (large trucks, ships, airplanes) transportation. Finally, residential buildings (including both construction and maintenance, electricity requirements, etc.) and waste management are responsible for about 8% and 3% of emissions respectively.
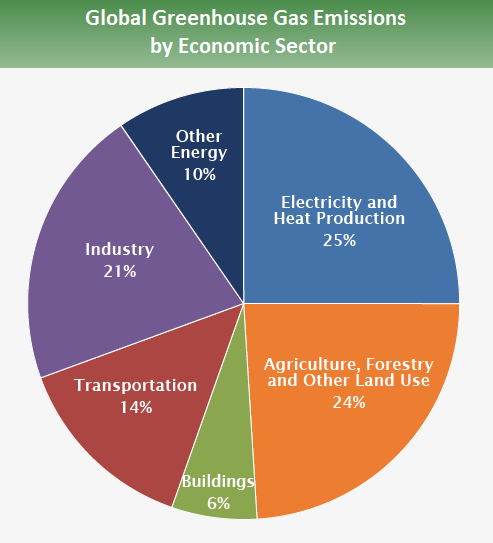
- Agriculture, Forestry, and Other Land Use: 24%
- Transport: 14%
- Residential and commercial buildings: 6%
- Electricity and Heat Production: 25%
- Other Energy: 10%
- Industry: 21%
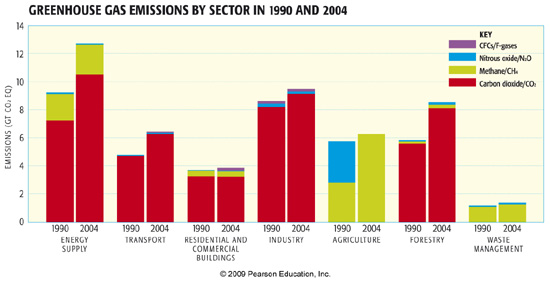
While it is useful to know what the historical contributions to our emissions have been from the various sectors, looking forward towards the future it is also important to know which sectors are growing most rapidly in their contribution to anthropogenic greenhouse emissions. By comparing emissions rates during the middle of the past decade with those at the beginning of the 1990s, we see that the largest absolute increase (an increase of nearly 3 gigatons/year of CO2 released) has been in the energy sector, though other sectors such as transport and forestry have shown similar (35-40%) increases in emissions over this time frame. It is logical to conclude that these sectors might demand special attention in considering possible emissions mitigation approaches.