You've read several times already in this text that geographic data is always generalized. As you recall from Chapter 1, generalization is inevitable due to the limitations of human visual acuity, the limits of display resolution, and especially to the limits imposed by the costs of collecting and processing detailed data. What we have not previously considered is that generalization is not only necessary, it is sometimes beneficial.
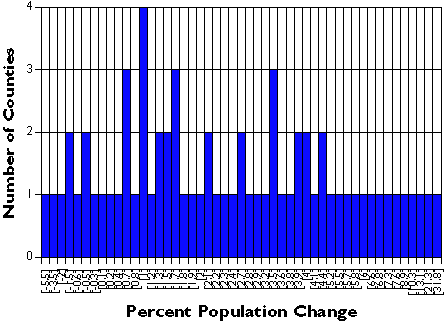
Generalization helps make sense of complex data. Consider a simple example. The graph below (Figure 3.18.1) shows the percent population change for Pennsylvania's 67 counties over a five-year period. Categories along the x axis of the graph represent each of the 49 unique percentage values (some of the counties had exactly the same rate). Categories along the y axis are the numbers of counties associated with each rate. As you can see, it's difficult to discern a pattern in these data.

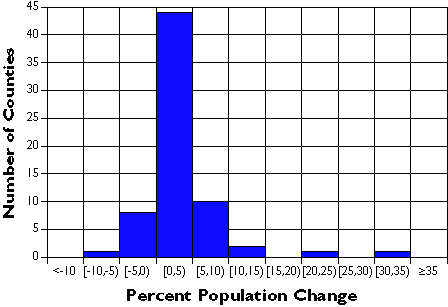
The following graph shows exactly the same data set, only grouped into 7 classes. It's much easier to discern patterns and outliers in the classified data than in the unclassified data. Notice that the mass of population change rates are distributed around 0 to 5 percent, and that there are two counties (x and y counties) whose rates are exceptionally high. This information is obscured in the unclassified data.

| Percent Population Change | Number of Counties |
|---|---|
| Less than -10 | 0 |
| [-10, -5) | 1 |
| [-5, 0) | 8 |
| [0, 5) | 44 |
| [5, 10) | 10 |
| [10, 15) | 2 |
| [15, 20) | 0 |
| [20, 25) | 1 |
| [25, 30) | 0 |
| [30, 35) | 1 |
| Greater than or equal to 35 | 0 |
Data classification is a means of generalizing thematic maps. Many different data classification schemes exist. If a classification scheme is chosen and applied skillfully, it can help reveal patterns and anomalies that otherwise might be obscured. By the same token, a poorly-chosen classification scheme may hide meaningful patterns. The appearance of a thematic map, and sometimes conclusions drawn from it, may vary substantially depending on data classification scheme used.