For many applications, 30-meter DEMs whose vertical accuracy is measured in meters are simply not detailed enough. Greater accuracy and higher horizontal resolution can be produced by photogrammetric methods, but precise photogrammetry is often too time-consuming and expensive for extensive areas. Lidar is a digital remote sensing technique that provides an attractive alternative.
Lidar stands for LIght Detection And Ranging. Like radar (RAdio Detecting And Ranging), lidar instruments transmit and receive energy pulses, and enable distance measurement by keeping track of the time elapsed between transmission and reception. Instead of radio waves, however, lidar instruments emit laser light (laser stands for Light Amplifications by Stimulated Emission of Radiation).
Lidar instruments are typically mounted in low altitude aircraft. They emit up to 5,000 laser pulses per second, across a ground swath some 600 meters wide (about 2,000 feet). The ground surface, vegetation canopy, or other obstacles reflect the pulses, and the instrument's receiver detects some of the backscatter. Lidar mapping missions rely upon GPS to record the position of the aircraft, and upon inertial navigation instruments (gyroscopes that detect an aircraft's pitch, yaw, and roll) to keep track of the system's orientation relative to the ground surface.
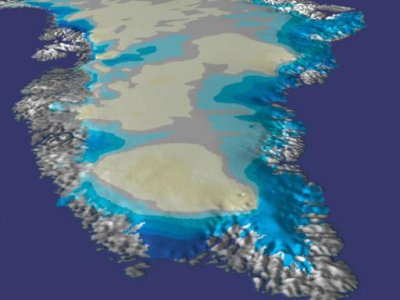
In ideal conditions, lidar can produce DEMs with 15-centimeter vertical accuracy, and horizontal resolution of a few meters. Lidar applications in topographic mapping, forestry, corridor mapping, and 3-D building modeling are discussed in detail in the open-access courseware for GEOG 481: Topographic Mapping with Lidar. Illustrated below is a scientific application in which lidar was used successfully to detect subtle changes in the thickness of the Greenland ice sheet that result in a net loss of over 50 cubic kilometers of ice annually.
To learn more about the use of lidar in mapping changes in the Greenland ice sheet, visit NASA’s Scientific Visualization Studio.