The term bathymetry refers to the process and products of measuring the depth of water bodies. The U.S. Congress authorized the comprehensive mapping of the nation's coasts in 1807, and directed that the task be carried out by the federal government's first science agency, the Office of Coast Survey (OCS). That agency is now responsible for mapping some 3.4 million nautical square miles encompassed by the 12-mile territorial sea boundary, as well as the 200-mile Exclusive Economic Zone claimed by the U.S., a responsibility that entails regular revision of about 1,000 nautical charts. The coastal bathymetry data that appears on USGS topographic maps, like the one shown below, is typically compiled from OCS charts.
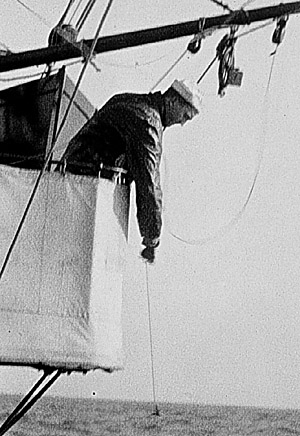
Early hydrographic surveys involved sampling water depths by casting overboard ropes weighted with lead and marked with depth intervals called marks and deeps. Such ropes were called leadlines for the weights that caused them to sink to the bottom. Measurements were called soundings. By the late 19th century, piano wire had replaced rope, making it possible to take soundings of thousands rather than just hundreds of fathoms (a fathom is six feet).
Echo sounders were introduced for deepwater surveys beginning in the 1920s. Sonar (SOund NAvigation and Ranging) technologies have revolutionized oceanography in the same way that aerial photography revolutionized topographic mapping. The seafloor topography revealed by sonar and related shipborne remote sensing techniques provided evidence that supported theories about seafloor spreading and plate tectonics.
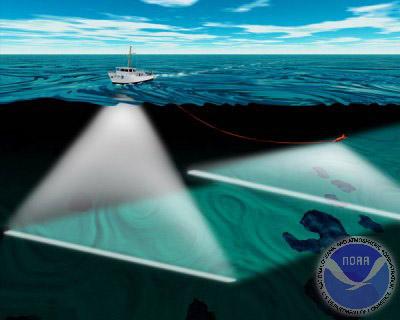
Below is an artist's conception of an oceanographic survey vessel operating two types of sonar instruments: multibeam and side scan sonar. On the left, a multibeam instrument mounted in the ship's hull calculates ocean depths by measuring the time elapsed between the sound bursts it emits and the return of echoes from the seafloor. On the right, side scan sonar instruments are mounted on both sides of a submerged "towfish" tethered to the ship. Unlike multibeam, side scan sonar measures the strength of echoes, not their timing. Instead of depth data, therefore, side scanning produces images that resemble black-and-white photographs of the seafloor.