FGDC (1997, p. 21) points out that:
Cadastral data represent the geographic extent of the past, current, and future rights and interests in real property. The spatial information necessary to describe the geographic extent and the rights and interests includes surveys, legal description reference systems, and parcel-by-parcel surveys and descriptions.
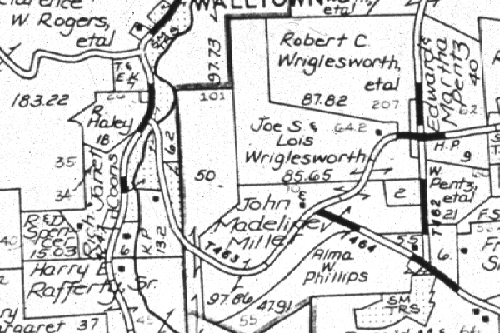
However, no one expects that legal descriptions and survey coordinates of private property boundaries (as depicted schematically in the portion of the plat map shown below) will be included in the USGS National Map any time soon. As discussed at the outset of Chapter 6, this is because local governments have authority for land title registration in the U.S., and most of these governments have neither the incentive nor the means to incorporate such data into a publicly-accessible national database.
FGDC's modest goal for the cadastral theme of the NSDI framework is to include:
...cadastral reference systems, such as the Public Land Survey System (PLSS) and similar systems not covered by the PLSS ... and publicly administered parcels, such as military reservations, national forests, and state parks. (Ibid, p. 21)
FGDC's Cadastral Data Content Standard is published here.
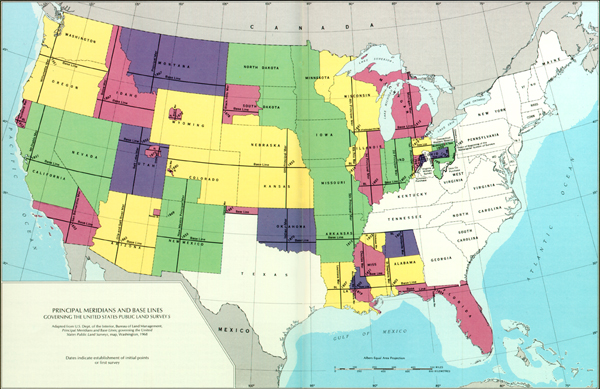
The colored areas on the map below show the extent of the United States Public Land Surveys, which commenced in 1784 and took nearly a century to complete (Muehrcke and Muehrcke, 1998). The purpose of the surveys was to partition "public land" into saleable parcels in order to raise revenues needed to retire war debt, and to promote settlement. A key feature of the system is its nomenclature, which provides concise, unique specifications of the location and extent of any parcel.
Each Public Land Survey (shown in the colored areas above) commenced from an initial point at the precisely surveyed intersection of a base line and principal meridian. Surveyed lands were then partitioned into grids of townships each approximately six miles square.
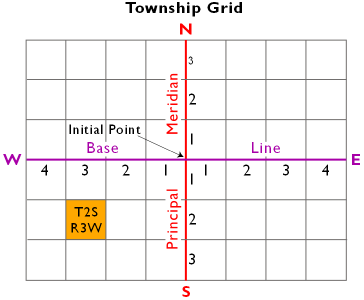
Townships are designated by their locations relative to the base line and principal meridian of a particular survey. For example, the township highlighted in gold above is the second township south of the baseline and the third township west of the principal meridian. The Public Land Survey designation for the highlighted township is "Township 2 South, Range 3 West." Because of this nomenclature, the Public Land Survey System is also known as the "township and range system." Township T2S, R3W is shown enlarged below.
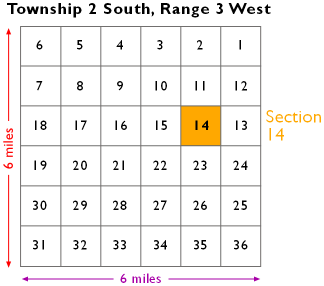
Townships are subdivided into grids of 36 sections. Each section covers approximately one square mile (640 acres). Notice the back-and-forth numbering scheme. Section 14, highlighted in gold above in Figure 7.19.4, is shown enlarged below in Figure 7.19.5.
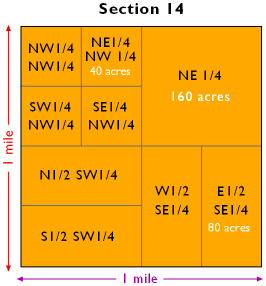
Individual property parcels are designated as shown in Figure 7.19.5. For instance, the NE 1/4 of Section 14, Township 2 S, Range 3W, is a 160-acre parcel. Public Land Survey designations specify both the location of a parcel and its area.
The influence of the Public Land Survey grid is evident in the built environment of much of the American Midwest. As Mark Monmonier (1995, p. 114) observes:
The result [of the U.S. Public Land Survey] was an 'authored landscape' in which the survey grid had a marked effect on settlement patterns and the shapes of counties and smaller political units. In the typical Midwestern county, roads commonly following section lines, the rural population is dispersed rather than clustered, and the landscape has a pronounced checkerboard appearance.