This page profiles three data products that include elevation (and, in one case, bathymetry) data for all or most of the Earth's surface.
ETOPO1
ETOPO1 is a digital elevation model that includes both topography and bathymetry for the entire world. It consists of more than 233 million elevation values which are regularly spaced at 1 minute of latitude and longitude. At the equator, the horizontal resolution of ETOPO1 is approximately 1.85 kilometers. Vertical positions are specified in meters, and there are two versions of the dataset: one with elevations at the “Ice Surface" of the Greenland and Antarctic ice sheets, and one with elevations at “Bedrock" beneath those ice sheets. Horizontal positions are specified in geographic coordinates (decimal degrees). Source data, and thus data quality, vary from region to region.
You can download ETOPO1 data from the National Geophysical Data Center.
GTOPO30
GTOPO30 is a digital elevation model that extends over the world's land surfaces (but not under the oceans). GTOPO30 consists of more than 2.5 million elevation values, which are regularly spaced at 30 seconds of latitude and longitude. At the equator, the resolution of GTOPO30 is approximately 0.925 kilometers -- two times greater than ETOPO1. Vertical positions are specified to the nearest meter, and horizontal positions are specified in geographic coordinates. GTOPO30 data are distributed as tiles, most of which are 50° in latitude by 40° in longitude.
GTOPO30 tiles are available for download from USGS' EROS Data Center.
Shuttle Radar Topography Mission (SRTM)
From February 11 to February 22, 2000, the space shuttle Endeavor bounced radar waves off the Earth's surface, and recorded the reflected signals with two receivers spaced 60 meters apart. The mission measured the elevation of land surfaces between 60° N and 56° S latitude. The National Aeronautics and Space Administration (NASA) and Jet Propulsion Laboratory (JPL) produced two SRTM data products—one at 1 arc-second resolution (about 30 meters), another at 3 arc-seconds (about 90 meters). Initially, access to the 30 meter SRTM data was restricted by the National Geospatial-Intelligence Agency (NGA), which sponsored the project along with NASA. However, in 2014 the White House announced at the U.N. Climate Summit that the high resolution SRTM data would be released globally over the coming year.
More information about the announcement, and about SRTM data, is available at JPL's SRTM site.
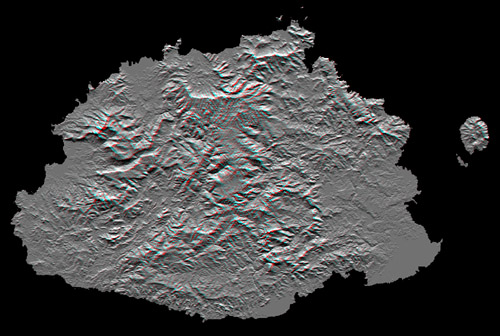
Figure 7.13.3 shows Viti Levu, the largest of the some 332 islands that comprise the Sovereign Democratic Republic of the Fiji Islands. Viti Levu's area is 10,429 square kilometers (about 4000 square miles). Nakauvadra, the rugged mountain range running from north to south, has several peaks rising above 900 meters (about 3000 feet). Mount Tomanivi, in the upper center, is the highest peak at 1324 meters (4341 feet).