In general, a DEM is any raster representation of a terrain surface. Specifically, the U.S. Geological Survey produced a nation-wide DEM called the National Elevation Dataset (NED), which has traditionally served a primary source of elevation data. The NED has been incorporated into a newer elevation data product at the USGS called the 3D Elevation Program (3DEP). Here we consider the characteristics of traditional DEMs produced by the USGS. Later in this chapter, we'll consider sources of global terrain data.
Identification
USGS DEMs are raster grids of elevation values that are arrayed in series of south-north profiles. Like other USGS data, DEMs were produced originally in tiles that correspond to topographic quadrangles. Large-scale (7.5-minute and 15-minute), intermediate scale (30 minute), and small-scale (1 degree) series were produced for the entire U.S. The resolution of a DEM is a function of the east-west spacing of the profiles and the south-north spacing of elevation points within each profile.
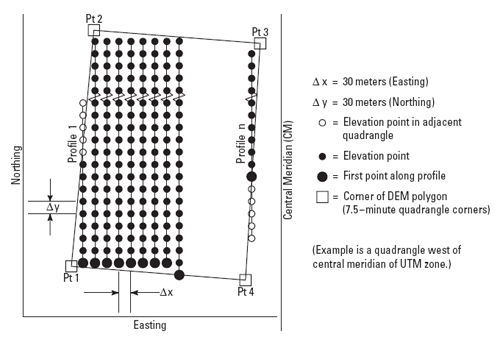
DEMs corresponding to 7.5-minute quadrangles are available at 10-meter resolution for much, but not all, of the U.S. Coverage is complete at 30-meter resolution. In these large-scale DEMs, elevation profiles are aligned parallel to the central meridian of the local UTM zone, as shown in Figure 7.8.1, below. See how the DEM tile in the illustration below appears to be tilted? This is because the corner points are defined in unprojected geographic coordinates that correspond to the corner points of a USGS quadrangle. The farther the quadrangle is from the central meridian of the UTM zone, the more it is tilted.
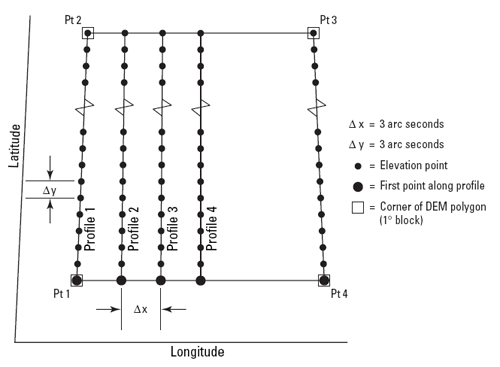
As shown in Figure 7.8.2, the arrangement of the elevation profiles is different in intermediate- and small-scale DEMs. Like meridians in the northern hemisphere, the profiles in 30-minute and 1-degree DEMs converge toward the north pole. For this reason, the resolution of intermediate- and small-scale DEMs (that is to say, the spacing of the elevation values) is expressed differently than for large-scale DEMs. The resolution of 30-minute DEMs is said to be 2 arc seconds and 1-degree DEMs are 3 arc seconds. Since an arc second is 1/3600 of a degree, elevation values in a 3 arc-second DEM are spaced 1/1200 degree apart, representing a grid cell about 66 meters "wide" by 93 meters "tall" at 45º latitude.
The preferred method for producing the elevation values that populate DEM profiles is interpolation from DLG hypsography and hydrography layers (including the hydrography layer enables analysts to delineate valleys with less uncertainty than hypsography alone). Some older DEMs were produced from elevation contours digitized from paper maps or during photogrammetric processing, then smoothed to filter out errors. Others were produced photogrammetrically from aerial photographs.
Data quality
The vertical accuracy of DEMs is expressed as the root mean square error (RMSE) of a sample of at least 28 elevation points. The target accuracy for large-scale DEMs is seven meters; 15 meters is the maximum error allowed.
Spatial Reference Information
Like DLGs, USGS DEMs are heterogenous. They are cast on the Universal Transverse Mercator projection used in the local UTM zone. Some DEMs are based upon the North American Datum of 1983, others on NAD 27. Elevations in some DEMs are referenced to either NGVD 29 or NAVD 88.
Entities and attributes
Each record in a DEM is a profile of elevation points. Records include the UTM coordinates of the starting point, the number of elevation points that follow in the profile, and the elevation values that make up the profile. Other than the starting point, the positions of the other elevation points need not be encoded, since their spacing is defined. (Later in this chapter, you'll download a sample USGS DEM file. Try opening it in a text editor to see what I'm talking about.)
Distribution
DEM tiles are available for free download through many state and regional clearinghouses. You can find these sources by searching the geospatial items on the Data.Gov site, formerly the separate Geospatial One Stop site.
As part of its National Map initiative, the USGS has developed a suite of elevation data products derived from traditional DEMs, lidar, and other sources. NED data are available at three resolutions: 1 arc second (approximately 30 meters), 1/3 arc second (approximately 10 meters), and 1/9 arc second (approximately 3 meters). Coverage ranges from complete at 1 arc second to extremely sparse at 1/9 arc second. As of 2020, USGS' elevation data products are managed through its 3D Elevation Program (3DEP). The second of the two following activities involves downloading 3DEP data and viewing it in Global Mapper.
Try This!
Exploring DEMs with Global Mapper
Global Mapper time again! This time, you'll investigate the characteristics of a USGS DEM. The instructions below assume that you have already installed the software on your computer. (If you haven't, return to installation instructions presented earlier in Chapter 6). The instructions will remind you how to open a DEM in Global Mapper.
- First, Download the DEM.zip data archive. The ZIP archive is 2.5 Mb in size. If you can't download the file, contact me right away so we can help you resolve the problem.
- Now, decompress the archive into a directory on your hard disk.
- Open the archive DEM.zip.
- Create a subdirectory called "DEM" within the directory in which you save data.
- Extract all files in the ZIP archive into your new subdirectory.
- Launch Global Mapper.
- Open a Digital Elevation Model by choosing File > Open Data File(s)..., then navigate to the directory DEM_30m or DEM_10m, then open the file bushkill_pa.dem
- Use the Zoom and Pan tools to magnify and scroll across the DEM. The Full View button (house icon) refreshes the initial full view of the dataset.
- To see the DEM data with(out) hill shading, find the Enable/Disable Hill Shading button (it has a sunburst in the lower left corner).
Enable hill shading. - You can also alter the appearance of the DEM by choosing Tools > Configure, and changing the settings in Vertical Options and Shader Options. Try this: on the Vertical Options tab select Gradient Shader from the pick list. Then, select the Shader Options tab and choose a color from each of the Low Color and High Color button in the Gradient Shader area. Hit the Apply button.
Go back to the Vertical Options tab and experiment with the Vertical Exaggeration slider. Hit Apply.
Try This!
Download your own National Elevation Dataset (NED) data
- Go to the National Map Download Tool.
- Navigate the map to zoom in on your hometown or other area of interest.
- Confirm that "Current Extent" is selected in the menu above the map. This specifies the area on the map for which you want to find data.
- Expand the "Elevation Products (3DEP)" section in the left-hand menu and check the box next to any dataset you'd like to download. (If given the option, specify to download the dataset in ArcGrid format.)
- Click the "Find Products" Button and use the links provided in the search results to show the footprint of each dataset on the map and to download your preferred DEM.
- A ZIP archive (.zip) will be created that you can save to your hard disk (e.g., "n45w100.zip"). Proceed to save the data file to your computer. The download process will take several seconds, depending upon your Internet download rate.
View the Dataset in Global Mapper
- Launch Global Mapper and navigate to where you saved the ZIP archive.
Double-click on the .zip file name. The data should display -- the software can read the data even in its compressed .zip form.
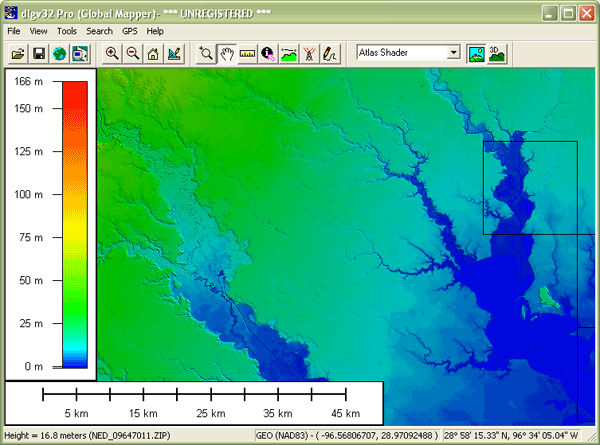
An image of the DEM data should appear in the Global Mapper window, similar to what you see shown below (even though the image below is from an older version of Global Mapper). If the Bushkill DEM is still visible, open the Control Center and uncheck the Bushkill DEM. Now click the Full View button (it is a picture of house) or click View > Full View. - To see the DEM data with(out) hill shading, find the Enable/Disable Hill Shading button on the Shader toolbar (it has a sunburst in the lower left corner).
Enable hill shading. - You can alter the appearance of the DEM by choosing Tools > Configure, and changing the settings in Vertical Options and Shader Options.
Try this: on the Vertical Options tab select Gradient Shader from the pick list. Then select the Shader Options tab and choose a color from each of the Low Color and High Color button in the Gradient Shader area. Hit the Apply button.
Go back to the Vertical Options tab and experiment with the Vertical Exaggeration slider. Hit Apply. - Again, you can view the metadata associated with the DEM data via the Tools > Control Center menu. Note the PIXEL dimensions reported in arc degrees, as opposed to something like meters.