In oil and gas production, Tubing is the pipe or conduit where fluids are transported from the reservoir to the surface. This is shown Figure 6.01. Figure 6.01 shows the Wellbore Schematic for a typical vertical well. This figure is a schematic cross-section through the axis of the well. This schematic shows two types of pipe, casing and tubing. The casing is used and installed during the drilling process, and we will discuss the purpose of the casing when we discuss the drilling process in Lesson 8. For now, we are interested in the tubing.
The tubing is the inner most string of pipe in the well. As I stated, this is the conduit that connects the reservoir to the surface. Reservoir fluids flow from the reservoir, through the perforations, into the tubing, and the up the well. In this well schematic, fluids are prevented from flowing through the Annular Space between the tubing and Production Casing String with a Packer (a packer is a device that seals the annular space between the production casing and tubing and mechanically prevents fluids from flowing through the annulus). It is the tubing that will be the focus of this lesson.

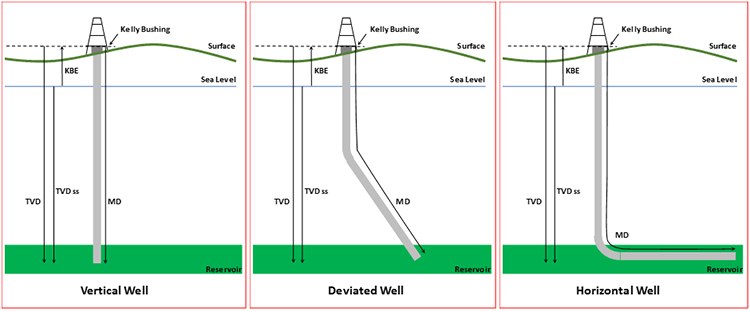
Wells drilled for oil and gas production (or fluid injection) are not always straight, vertical wells. Wells can be designed to be straight, deviated, or horizontal. This is shown in Figure 6.02 for three common well types: vertical wells, deviated wells, and horizontal wells. In addition to wells that were planned to be deviated, wells that were planned to be straight, vertical wells often deviate from the true vertical direction during the drilling process.
In the field, the measurement of the three-dimensional path of a well is called a Directional Survey. A directional survey can be performed with either magnetic or gyroscopic instrumentation. The data recorded during a directional survey include:
- the True Vertical Depth, TVD
- the Measured Depth, MD
- the well inclination from the vertical (0° for a vertical well and 90° for a horizontal well). Note, for our flow calculations, we will use inclination from the horizontal
- the well direction N-S-E-W or 0 - 360°)
The objectives of the directional survey are to:
- determine the exact bottom-hole location;
- monitor the well’s progress during drill to ensure the well will reach the intended target;
- orient the deflection of any tools run in the well to ensure tools can traverse the well path;
- establish the relationship of TVD and MD for in support of well logging and wellbore hydraulics modeling; and
- calculate the TVD of various geologic formations to allow for proper geological mapping.
Figure 6.02 depicts three wells. In this figure, the Kelly Bushing is the mechanical assembly that rotates on the rig floor causing the drill pipe and drill bit to rotate. We will learn much more about the Kelly Bushing in Lesson 8. The Kelly Bushing (and, essentially, the rig floor) is a common reference point for depths/lengths in a well. This figure shows four common measurements used in the oil and gas industry for the well lengths and depths:
- TVD: True Vertical Depth is the depth (or length) in the true vertical direction measured from the Kelly Bushing to the point of interest.
- TVD ss: True Vertical Depth sub-sea is the depth (or length) in the true vertical direction measured from the mean sea level to the point of interest.
- MD: Measured Depth is the path length of the depth (or length) measured from the Kelly Bushing to the point of interest.
- KBE: The Kelly Bushing Elevation is the elevation of the Kelly Bushing measured from the sea level.
As we will see, these measurements can have a significant impact on the tubing hydraulics once the well is put onto production or injection. For example, gravity (and hydrostatic pressure) and the geothermal gradient will act in the true vertical direction (TVD), while friction will act along the total length of the tubing (MD).
As oil enters the well and begin flow upwards several Flow Regimes or Flow Patterns can occur in the tubing. These flow patterns in vertical flow are shown in Table 6.01.
| Vertical Cross-section | Description |
|---|---|
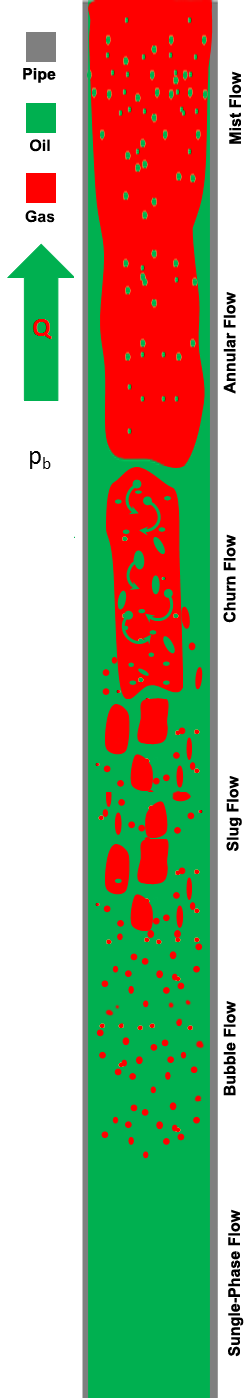 |
Mist Flow:
|
Annular Flow:
|
|
Churn Flow:
|
|
Slug Flow:
|
|
Bubble Flow:
|
|
Single-Phase Flow:
|
|
| Image by Greg King © Penn State, is licensed under CC BY-NC-SA 4.0 | |
When crude oil first enters the well and tubing, it may be above its bubble-point pressure (note, if the reservoir is below the bubble-point pressure, then free gas will enter the well and tubing and a more continuous gas phase will be present in the base of the tubing near the perforations). As the liquid flows up the tubing, pressure is expended as a pressure differential is required to lift the liquid column to the surface.
At some point, the pressure falls below the bubble-point pressure in the tubing, and gas begins to come out of solution. As we discussed in Lesson 2, crude oils and natural gases are complex mixtures hydrocarbon molecules. Figure 6.03 is a Phase Diagram for an undersaturated oil reservoir (crude oil above its bubble-point pressure). In Lesson 4 and Lesson 5, we discussed the behavior of the crude oil and natural gas in the reservoir. This is the solid p-T path shown in Figure 6.03: Path (, ) to (, ).
The dashed p-T path in Figure 6.03 is the path that the fluids take going from the reservoir to the surface separator. Remember, we have seen in Lesson 4 and Lesson 5 that in the reservoir as we remove fluids, the reservoir pressure is reduced. Therefore, the starting point for the path to the separators, Path (, ) to (, , will be the time-dependent current reservoir pressure,
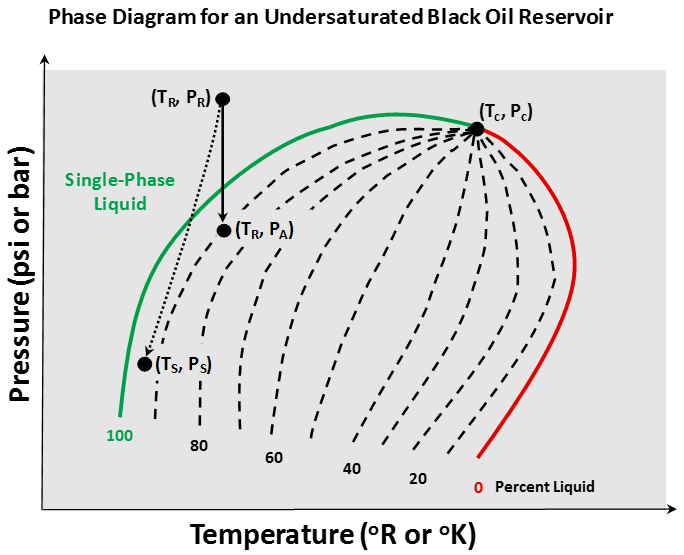
As fluids travel up the well along the dashed path in Figure 6.03, we can see that the tubing flow is a non-isothermal process; the temperature of the flowing fluid changes due to the local geothermal gradient. This has several implications in the tubing hydraulics process. For example, as we see in Figure 6.03, the bubble-point pressure (the pressure where the path enters the two-phase region) for the solid reservoir path, Path (, ) to (, ), is different from the bubble-point pressure for the dashed tubing path, Path (, ) to (, ). It is the bubble-point pressure along the dashed path that results in the onset of the bubble flow pattern shown in Table 6.01.
As flow continues up the tubing in Table 6.01, the pressure continues to fall causing gas bubbles to expand due to the compressible nature of gas and solution gas to come out of solution. As the gas bubbles expand, they begin to coalesce and form gas slugs in the center of the tubing. Due to buoyancy, the gas slugs travel at a higher velocity than the liquid and begin to push the liquid up the tubing.
As flow continues up the tubing, the gas slugs continue to expand and begin to form a continuous phase in the center of the tubing. This is the churn flow pattern shown in Table 6.01. During churn flow, high velocity gas pushes liquids up the well, but liquid tends to slip back downward due to its density. As flow continues upward, the continuous gas phase pushes the liquid up the tubing with gas flowing rapidly in the center of the tubing and the liquid flowing slower in the annular space between the tubing walls and the continuous gas phase. This is the annular flow pattern shown in Table 6.01.
As gas and liquid continue to flow upward, the gas phase expands further, leaving less room on the tubing walls for the liquid. During this flow regime, liquids are pushed upwards in liquid slugs and as mist entrained in the gas.
We should remember that not all of these flow regimes occur in all wells. The flow regimes occurring in the tubing will be determined by the conditions in the well. For example, if an undersaturated crude oil reservoir is being produced and the wellhead pressure, , is kept above the surface bubble-point pressure, then the well will only flow in the single-phase flow regime.
As we can see from Figure 6.02, wells can be planned and executed as deviated (or slanted) wells and as horizontal wells. Flow through the tubing in the horizontal section of a well has distinct flow patterns. These flow patterns are illustrated in Table 6.02.
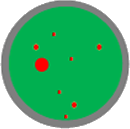
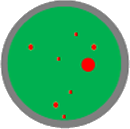
| Cross-Section | Longitudinal-Section | Description |
|---|---|---|
 |
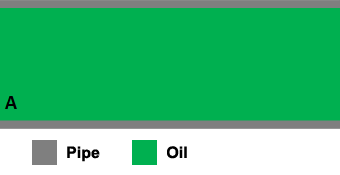 |
Single-Phase Flow:
|
 |
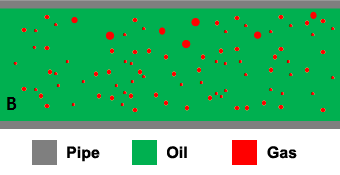 |
Bubble Flow:
|
 |
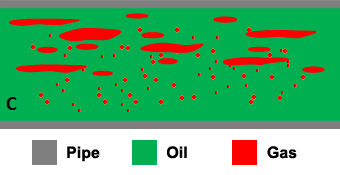 |
Plug Flow:
|
 |
 |
Stratified Flow:
|
 |
 |
Wavy Flow:
|
 |
 |
Slug Flow:
|
 |
 |
Annular Flow:
|
 |
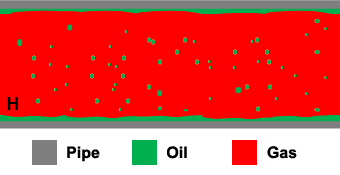 |
Spray Flow:
|
|
Source: All images by Greg King © Penn State, licensed under CC BY-NC-SA 4.0
|
||
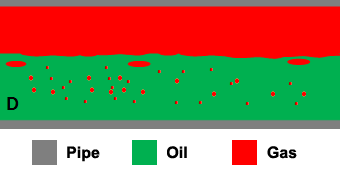
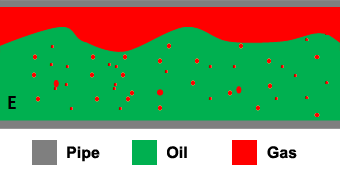
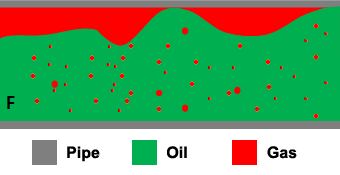
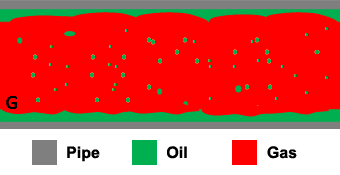
Referring to Table 6.02, as with vertical tubing, if oil enters the horizontal tubing above the bubble-point pressure, then flow will be single-phase and the liquid will be transported in the Single-Phase Flow Regime. As pressure travels horizontally, the pressure differential required to transport the liquid may cause the pressure to drop below the bubble-point pressure of the oil. When this occurs, the tubing fluids enter the Bubble Flow Regime (B). As pressure drops further due to liquid transport, the bubbles expand and coalesce to form gas plugs. When this occurs, the gas and liquid enter the Plug Flow Regime (C). As pressures continue to drop, the gas plugs continue to expand and coalesce, eventually forming a continuous gas phase. If the phase velocities are low, then gravity will act to segregate the phases vertically. This is the Segregated Flow Regime (D). In the segregated flow regime, the surface between the two phases is relatively smooth. If velocities are higher, then the surface of the two segregated phases may develop waves and ripples. This is the Wavy Flow Regime (E). If the velocities are greater still, then the height of the waves may reach the top of the tubing, temporarily closing off the cross-section to the flow of gas. This is the Slug Flow Regime (F). The slug flow regime results in very unstable flow because of the differences in the momentum between the gas and liquid phases due to the different densities and different phase velocities. When the cross-section is cut off to the gas phase, its momentum must be transferred to the liquid phase. At higher velocities, gravity acts too slow to segregate the phases and the flow may enter the Annular Flow Regime (G). In this flow regime, the continuous gas phase occupies the center of the tubing, while liquid phase forms an annular ring between the gas phase and the tubing wall. While gravity may be too slow to create complete vertical segregation, the less dense gas phase may flow higher in the tubing (i.e., the gas and oil may flow in a non-concentric manner). Finally, if the velocity is very high, the gas may occupy most of the cross-section and liquid is transported as a mist that is entrained in the gas. This occurs in the Spray Flow Regime (H). Spray flow is a very stable flow regime with the liquid and gas phases traveling at comparable velocities.
These are the basic flow regimes that can occur in vertical and horizontal tubing. We will revisit these flow regimes when we discuss Multi-Phase Tubing Performance later in this lesson.