The analyses used for multi-phase flow are identical to those used for single-phase flow: pressure traverse calculations and tubing performance calculations. Figure 6.13 shows typical multi-phase pressure traverse plots using the Hagedorn and Brown Correlation. As seen in the legends of these plots, this figure indicates that the pressure drop is dependent on all of the properties listed in Table 6.05.
The difference in the pressure traverse curves shown in Figure 6.13, is the Watercut (fraction of water) in the produced stream: 0.0 for the family of curves on the left and 0.5 for the family of curves on the right. In these pressure traverse curves, the Static Properties (properties that are assumed to be constant over time) are the tubing I.D. the tubing lengths (TVD and MD), the oil API gravity, the gas specific gravity, and the water specific gravity; while the Dynamic Properties (properties that normally vary over time) are the wellhead pressure, the watercut , the gas/liquid ratio (GLR), and the production (liquid) rate. Other dynamic properties that are changing in the calculations include the flow regime, the hold-up, the local fluid (and mixture) properties, and friction factor.
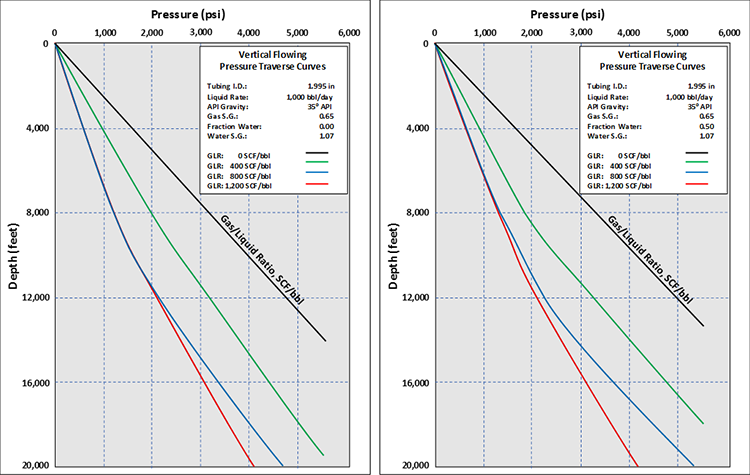
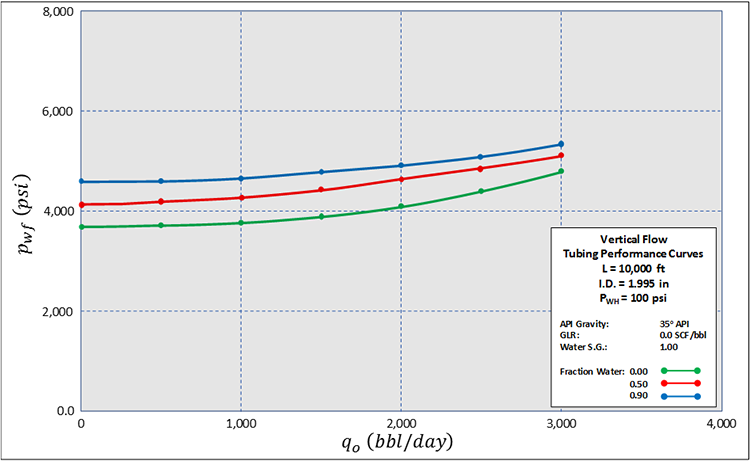
Figure 6.14 shows typical multi-phase tubing performance curves using the Hagedorn and Brown correlation. This figure shows a single, 10,000 ft tubing string with three different watercut values, 0.0, 0.5, and 0.9. The reason that the curve with the highest watercut (blue curve) has the highest flowing bottom-hole pressures, , is because water has a higher density than the oil which results in a heaver fluid column in the well. In the case of Figure 6.14, the 35º API crude oil has a specific gravity of 0.85, while the water has a specific gravity of 1.0.