During drilling operations, filtrate from the drilling fluid can seep into the reservoir, causing several potential problems including swelling of clays, resulting in a restriction of pores causing a thin zone of absolute permeability degradation near the wellbore, and the formation of a two-phase zone, resulting in effective permeability impairment due to the impact of relative permeability near the well. In addition, fluid production may cause Fines Movement (movement of loose rock materials and debris) from the reservoir interior towards the well. Finally, the well may also be Stimulated (near well increase in permeability) by the use of a Hydraulic Fracturing Treatment or an Acid Stimulation Treatment.
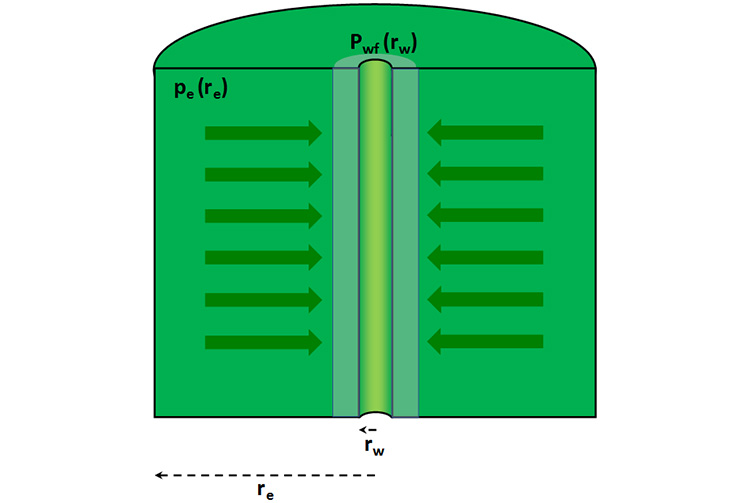
This well damage or stimulation is introduced into the analyses with a Skin Factor (local, near-wellbore adjustment to the pressure drop – reduced or increased – due to permeability modification for reasons other than geological reasons). This damage or stimulation is called a “skin” factor because it results in a relatively small zone of increased pressure-drop (or increase) near the well. This skin zone is illustrated in Figure 4.02 as the light green zone adjacent to the well.
In reservoir Engineering, we quantify this additional pressure drop in the skin zone by use of a dimensionless parameter, . From Equation 4.14, we have:
By inspection, we can see that the left-hand side of this equation is dimensionless which implies that the right-hand side must also be dimensionless. Therefore, we can add our dimensionless skin factor, , to the left-hand side of the equation:
By doing this, in order to maintain the equality, we have either (1) modified the pressure drop, , if the production rate, , is fixed or, (2) modified the production rate if the pressure drop is fixed. Rearranging Equation 4.17 to the form of Equation 4.15 results in:
Well damage will occur if the permeability in the skin zone is less than the natural permeability of the reservoir, while stimulation will occur if the permeability in the skin zone is greater than the natural permeability of the reservoir. From Equation 4.18, we can see that if the skin factor, , is positive, then it results in a reduction in the production rate if the pressure drop is fixed. Therefore, a positive skin factor is an indication of damage to the well. On the other hand, a negative value of skin factor results in an increase in the production rate if the pressure drop is fixed. Therefore, a negative value of the skin factor is an indication of stimulation to the well.
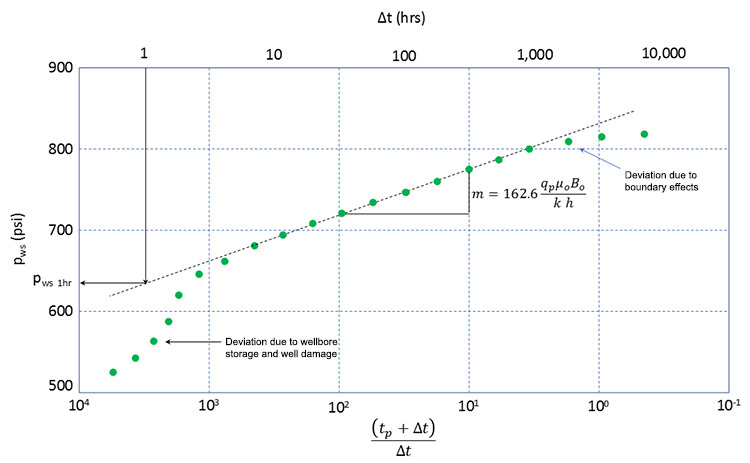
In the field, the skin factor can be determined from a pressure transient test, such as a pressure build-up test. In Lesson 3, we described a pressure build-up test and its analysis tool, the Horner Plot (see Figure 3.05). For convenience, this figure has been copied from Lesson 3 and is shown as Figure 4.03.
In that lesson, we discussed the Horner Plot in the context of field measurements of reservoir permeability. In that discussion, we saw that if we first produced a well at a stabilized rate, , for a certain period of time, , (the stabilized production time) and followed this by shutting in the well, then we could estimate the effective permeability to oil in the reservoir, , by the way that the shut-in pressures, , Built-Up (increased) over time. We quantified our analyses using the resulting Horner Plot:
Where:
Where:
- is the effective permeability to oil, md
- 162.6 is an equation constant
- is the oil production rate during the stabilized production period, STB/day
- is the oil viscosity, cp
- is the oil phase formation volume factor, bbl.STB
- is the slope of the Horner plot, in psi/cycle
- is the thickness of the reservoir, ft
- is the shut-in well pressure estimated from the linear portion of the plot, psi
Remember, as we discussed in Lesson 3, the effective permeability is the product of the relative permeability to oil and the absolute permeability of the rock formation:
We need to keep the relative permeability in our field calculations because all reservoirs will contain a water saturation (at the minimum it will be the irreducible water saturation, ). In addition to the effective permeability to oil, we can also determine the skin factor from the well test. For an arbitrary shut-in time increment, , the skin factor can be calculated from:
By convention, the time used in the skin analysis is normally taken to be one hour: . Substituting into Equation 4.22a:
Where:
- 1.1513 and 3.2275 are equation constants
- is the slope of the linear portion of the Horner plot, psi/cycle
- is the shut-in well pressure after 1 hr estimated from the linear portion of the Horner plot (see Figure 4.03), psi
- is the last measured flowing pressure during the stabilized production period ( at , i.e., ), psi
- is the total time duration of the stabilized production period, hrs
- is the time increment from the start of the well shut-in period, hrs
- is the effective permeability to oil, md
- is the porosity of the reservoir, fraction
- is oil viscosity, cp
- is total compressibility of the system, 1/psi
- is the well radius, ft
We can further simplify Equation 4.22b in cases where . In these cases, the expression in the first logarithmic term, , causing this term to vanish: remember, . In these cases, Equation 4.22b becomes:
When reservoir or production engineers design a pressure build-up test, they normally design it so that this approximation is valid. We can see from Equation 4.22, that in order to estimate the skin factor, we must first estimate the effective permeability, , and slope, , from Equation 4.19 and Equation 4.20.
You will notice that I use the term “estimate” when I discuss the application of these field methods for the determination of reservoir or well properties as opposed to “calculate”; this is intentional. While Equation 4.19 through Equation 4.22 are theoretically sound equations, (1) all of the properties used in them (, , , , , , , , , and ), to some degree have measurement error associated with them, and (2) many of the assumptions used in the equation development (uniform thickness, uniform permeability, etc.) may not be strictly applicable to our reservoir.