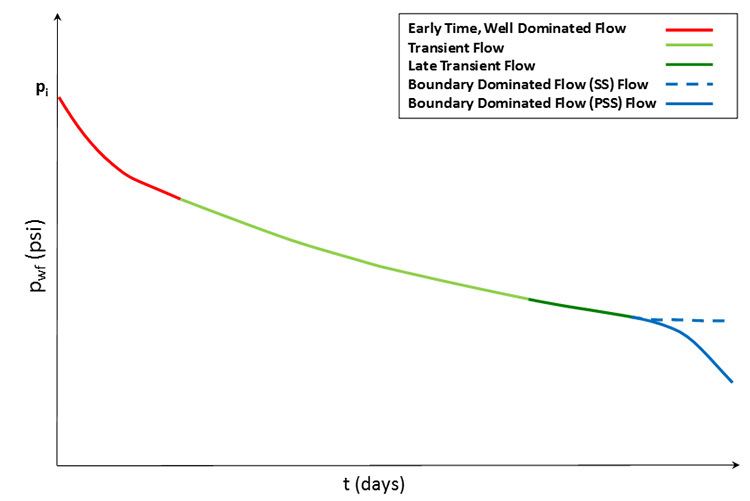
In Figure 4.06, the flowing well pressures, , are plotted as a function of time for a constant production rate. These flowing well pressures are the points, “•”, plotted in Figure 4.05. In this figure, several flow regimes are illustrated; some we have already discussed; others we have not.
For early times (solid red curve), the well pressure response is dominated well damage, well storage, or both. We have already discussed well damage earlier in this lesson. Well storage is the pressure response due to the liquids and gas in the well itself. Because the liquids are slightly compressible, and the gas is compressible, the flowing pressure of the well, , will be influenced by the compressibility of the fluids in the well.
The transient period (solid light green curve) in Figure 4.06 is flow regime that we are discussing in this subsection. The transient behavior of the well is described by the partial differential equation, Equation 4.30. The general solution to this equation forms the basis for Pressure Transient Analysis, PTA – such as the Pressure Build-Up Test and Horner Plot – that we discussed earlier.
The solid, dark green curve represents the late transient flow regime. As we have discussed, as a pressure disturbance caused by production travels through the reservoir, it will eventually encounter the boundaries of the drainage volume. For radial-cylindrical drainage areas in reservoirs with Homogeneous (uniform) and Isotropic (no directional preference) properties, this pressure disturbance comes into contact with all of the boundaries instantaneously (or at least over a short time interval).
For square drainage areas, the pressure disturbance will contact the edges of the boundary first followed by the corners. For rectangular drainage areas, the pressure disturbance would first contact the boundaries on the short side of the rectangle, followed by the boundaries on the long side of the rectangle, and finally the corners of the rectangle. Therefore, for shapes other than cylindrical, the time duration for the pressure disturbance to contact all of the drainage volume boundaries may be drawn out. The late transient period is then defined as the period for the pressure disturbance to contact the first boundary through the last boundary of the drainage volume.
The boundary dominated period is shown by the two blue curves in Figure 4.06 with the dashed blue curve representing the steady-state flow regime and the solid blue curve representing the pseudo steady-state regime. We have already discussed these two flow regimes in detail in this lesson.