Reminder!
After completing your Summative Assessment, don't forget to take the Module 3 Quiz. If you didn't answer the Learning Checkpoint questions, take a few minutes to complete them now. They will help your study for the quiz and you may even see a few of those question on the quiz!Peak Oil Activity
You have, by now, learned some things about “peak oil”, the notion that the production of oil is at or near a peak and will decline in the future, forcing us to conserve more and shift to other sources for our energy needs in the future. The goal of this activity is to explore this notion of peak oil in a bit more depth, to understand how it is a natural consequence of supplies, demands, prices.
In this activity, we’ll be using computer models created in a program called STELLA. STELLA models are simple computer models that are perfect for learning about the dynamics of systems — how systems change over time. Systems, in this case are sets of related processes that are involved in the transfer and storage of some quantity. For example, the global water cycle is a system that involves processes like evaporation, precipitation, surface water runoff, groundwater flow, moving water from one place to another. Earth’s climate system is set of related processes involved in the absorption, storage, and radiation of thermal energy. In fact, you can think of the whole Earth as one big, complex system. Through the use of computer models, we can learn some important things about how they work, how they react to changes; this understanding can then help us make smart decisions about how respond and adapt to a changing world.
What is a STELLA model?
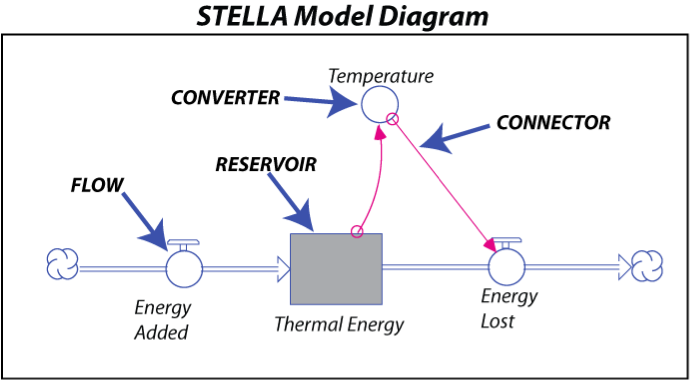
A STELLA model is a computer program containing numbers, equations, and rules that together form a description of how we think a system works — it is a kind of simplified mathematical representation of a part of the real world. Systems, in the world of STELLA, are composed of a few basic parts that can be seen in the diagram below:

Terminology
A Reservoir is a model component that stores some quantity — thermal energy in this case.
A Flow adds to or subtracts from a Reservoir — it can be thought of as a pipe with a valve attached to it that controls how much material is added or removed in a given period of time. In the above example, the Energy Added flow might be a constant value, while Energy Lost would be an equation that involves Temperature. The cloud symbols at the ends of the flows signify that the material or quantity has a limitless source, or sink.
A Connector is an arrow that establishes a link between different model components — it shows how different parts of the model influence each other. The labeled connector, for instance, tells us that the Energy Lost flow is dependent on the Temperature of the planet.
A Converter is something that does a conversion or adds information to some other part of the model. In this case, the Temperature converter takes the thermal energy stored in the Thermal Energy reservoir and converts it into a temperature using an equation.
To construct a STELLA model, you first draw the model components and then link them together. Equations and starting conditions are then added (these are hidden from view in the model) and then the timing is set — telling the computer how long to run the model and how frequently to do the calculations needed to figure out the flow and accumulation of quantities the model is keeping track of. When the system is fully constructed, you can essentially press the ‘on’ button, sit back, and watch what happens.
In this course, the models have all been made; you will interact with the models by changing variables with a user interface that has knobs and dials and then running the models to see how they change over time.
We will start with the simplest model we can imagine that represents the consumption of oil and gas and then we will work with progressively more complex versions of the model.
Instructions
This assessment is broken into five sub-parts with questions related to each part. Separate web pages have been provided for each part to reduce scrolling. We have also provided the activity as a worksheet that you can download and even print if you prefer. You may find downloading or printing the complete worksheet easier to work with as you prepare your answers to submit to the Mod 3 Summative Assessment (Graded) quiz.
Files to Download
Download the worksheet. Completing the 'Practice' and 'Graded' versions of the exercise, in the following pages or on the attached worksheet, is required before submitting your assignment.
Submitting Your Assessment
Once you have answered all of the questions on the worksheet, go to the Module 3 Summative Assessment (Graded) quiz, in which you will see the worksheet link again and the Graded Assessment. The worksheet has practice questions with answers provided and then graded versions of similar questions. Use the practice questions to make sure you are running the model correctly and reading the graphs properly, then do the graded questions, writing down your answers. The questions listed in the worksheet are repeated in the Canvas Assessment, so all you will have to do is read the question and select the answer that you have on your worksheet. You should not need much time to submit your answers since all of the work should be done prior to logging into clicking the assessment quiz.
Grading
This assignment is worth a total of 19 points -- the questions are all multiple choice.
