One important use of remote sensing is as input to the production of reference maps that cover the U.S. (and other countries). An important part of the process of utilizing remotely sensed information for mapping is rectification of the imagery; that process produces orthoimages. The U.S. Federal Geographic Data Committee (FGDC, 1997, p. 18) defines orthoimage as "a georeferenced image prepared from an aerial photograph or other remotely sensed data ... [that] has the same metric properties as a map and has a uniform scale." Unlike orthoimages, the scale of ordinary aerial images varies across the image, due to the changing elevation of the terrain surface (among other things). The process of creating an orthoimage from an ordinary aerial image is called orthorectification. Photogrammetrists are the professionals who specialize in creating orthorectified aerial imagery, and in compiling geometrically-accurate vector data from aerial images. So, to appreciate the requirements of the orthoimagery and its use in national mapping efforts (which will be discussed in more detail in Chapter 8), we first need to investigate the field of photogrammetry.
7.8.1 Photogrammetry
Photogrammetry is a profession concerned with producing precise measurements of objects from photographs and photoimagery. One of the objects measured most often by photogrammetrists is the surface of the Earth. Since the mid-20th century, aerial images have been the primary source of data used by USGS and similar agencies to create and revise topographic maps. Before then, topographic maps were compiled in the field using magnetic compasses, tapes, plane tables (a drawing board mounted on a tripod, equipped with a leveling telescope like a transit), and even barometers to estimate elevation from changes in air pressure. Although field surveys continue to be important for establishing horizontal and vertical control, photogrammetry has greatly improved the efficiency and quality of topographic mapping.
A vertical aerial photograph is a picture of the Earth's surface taken from above with a camera oriented such that its optical axis is vertical. In other words, when a vertical aerial photograph is exposed to the light reflected from the Earth's surface, the digital imaging surface (historically, it was a sheet of photographic film) is parallel to the ground. In contrast, an image you might create by snapping a picture of the ground below while traveling in an airplane is called an oblique aerial photograph, because the camera's optical axis forms an oblique angle with the ground.
A straight line between the center of a lens and the center of a visible scene is called an optical axis. The nominal scale of a vertical air photo is equivalent to f / H, where f is the focal length of the camera (the distance between the camera lens and the image surface -- usually six inches), and H is the flying height of the aircraft above the ground. It is possible to produce a vertical air photo such that scale is consistent throughout the image. This is only possible, however, if the terrain in the scene is absolutely flat. In rare cases where that condition is met, topographic maps can be compiled directly from vertical aerial photographs. Most often, however, air photos of variable terrain need to be transformed, or rectified, before they can be used as a source for mapping.
Government agencies at all levels need up-to-date aerial imagery. Early efforts to sponsor complete and recurring coverage of the U.S. included the National Aerial Photography Program (NAPP), which replaced an earlier National High Altitude Photography program in 1987. NAPP was a consortium of federal government agencies that aimed to jointly sponsor vertical aerial photography of the entire lower 48 states every seven years or so at an altitude of 20,000 feet, suitable for producing topographic maps at scales as large as 1:5,000. More recently NAPP has been eclipsed by another consortium called the National Agricultural Imagery Program (NAIP).
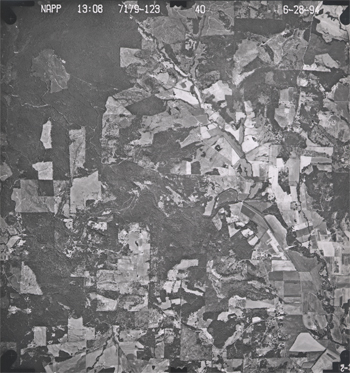
Aerial photography missions involve capturing sequences of overlapping images along many parallel flight paths. In the portion of the air photo mosaic shown below, note that the photographs overlap one another end to end, and side to side. This overlap is necessary for stereoscopic viewing, which is the key to rectifying photographs of variable terrain. It takes about 10 overlapping aerial photographs taken along two adjacent north-south flight paths to provide stereo coverage for a 7.5-minute quadrangle.
Try This
Use the USGS' EarthExplorer to identify the vertical aerial photograph that shows the "populated place" in which you live. How old is the photo? (EarthExplorer is part of a USGS distribution system.)
Note: The Digital Orthophoto backdrop that EarthExplorer allows you to view is not the same as the NAPP photos the system allows you to identify and order. By the end of this lesson, you should know the difference! If you don't, use the Chapter 6 Discussion Forum to ask.
7.8.2 Perspective and Planimetry
To understand why topographic maps can't be traced directly off of most vertical aerial photographs, you first need to appreciate the difference between perspective and planimetry. In a perspective view, all light rays reflected from the Earth's surface pass through a single point at the center of the camera lens. A planimetric (plan) view, by contrast, looks as though every position on the ground is being viewed from directly above. Scale varies in perspective views. In plan views, scale is everywhere consistent (if we overlook variations in small-scale maps due to map projections). Topographic maps are said to be planimetrically correct. So are orthoimages. Vertical aerial photographs are not.
As discussed above, the scale of an aerial photograph is partly a function of flying height. As terrain elevation increases, flying height in relation to the terrain decreases and photo scale increases. As terrain elevation decreases, flying height increases and photo scale decreases. Thus, variations in elevation cause variations in scale on aerial photographs. Specifically, the higher the elevation of an object, the farther the object will be displaced from its actual position away from the principal point of the photograph (the point on the ground surface that is directly below the camera lens, Figure 7.10). Conversely, objects at positions lower than the mean elevation of the surface will be displaced toward the principal point. This effect, called relief displacement, is illustrated in the diagram below. Note that the effect increases with distance from the principal point; scale distortion is zero at the principal point.
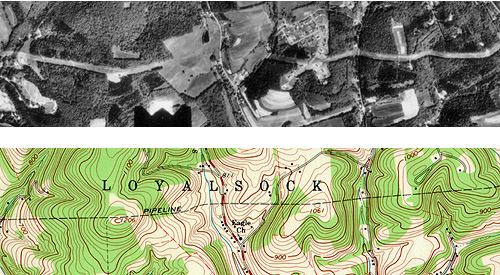
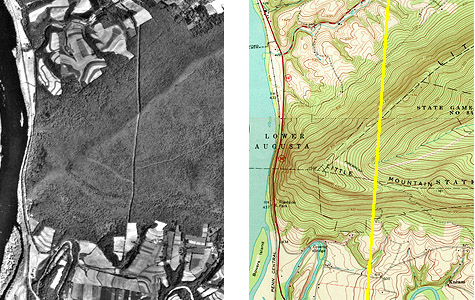
Compare the map and photograph below. Both show the same gas pipeline, which passes through hilly terrain. Note the deformation of the pipeline route in the photo relative to the shape of the route on the topographic map. The deformation in the photo is caused by relief displacement. The photo would not serve well on its own as a source for topographic mapping.
Confused? Think of it this way: where the terrain elevation is high, the ground is closer to the aerial camera, and the photo scale is a little larger than where the terrain elevation is lower. Although the altitude of the camera is constant, the effect of the undulating terrain is to zoom in and out. The effect of continuously-varying scale is to distort the geometry of the aerial photo. This effect is called relief displacement.
Distorted perspective views can be transformed into plan views through a process called rectification. Digital aerial photographs can be rectified using specialized photogrammetric software that shifts image locations (encoded digitally as pixels) toward or away from the principal point of each photo in proportion to two variables: the elevation of the point of the Earth's surface at the location that corresponds to each pixel, and each pixel's distance from the principal point of the photo.
Another way to rectify perspective images is to view pairs of images stereoscopically.
7.8.3 Stereoscopy
If you have normal or corrected vision in both eyes, your view of the world is stereoscopic. Viewing your environment simultaneously from two slightly different perspectives enables you to estimate very accurately which objects in your visual field are nearer, and which are farther away. You know this ability as depth perception.
When you fix your gaze upon an object, the intersection of your two optical axes at the object form what is called a parallactic angle. The keenness of human depth perception is what makes photogrammetric measurements possible.
Your perception of a three-dimensional environment is produced from two separate two-dimensional images. The images produced by your eyes are analogous to two aerial images taken one after another along a flight path. Objects that appear in the area of overlap between two aerial images are seen from two different perspectives. A pair of overlapping vertical aerial images is called a stereopair. When a stereopair is viewed such that each eye sees only one image, it is possible to “see” a three-dimensional image of the area of overlap.
If you have access to a pair of red-cyan (anaglyph) glasses (some of you might have a cardboard pair obtained for viewing 3D movies), you will be able to see the image in this video in 3D: Micro-Images Stereo Zoom-In (the video has a 3D control that allows you to manipulate some viewing options, but you will not see 3D without either a pair of anaglyph glasses or special graphics hardware on your computer). Without such glasses, you will see a somewhat messy looking merger of slightly offset images in these colors.
7.8.4 Rectification by Stereoscopy
Aerial images need to be transformed from perspective views into plan views before they can be used to trace the features that appear on topographic maps, or to digitize vector features in digital data sets. One way to accomplish the transformation is through stereoscopic viewing.
Below are portions of a vertical aerial photograph and a topographic map that show the same area, a synclinal ridge called "Little Mountain" on the Susquehanna River in central Pennsylvania. A linear clearing, cut for a power line, appears on both (highlighted in yellow on the map). The clearing appears crooked on the photograph due to relief displacement. Yet, we know that an aerial image like this one was used to compile the topographic map. The air photo had to be rectified to be used as a source for topographic mapping.
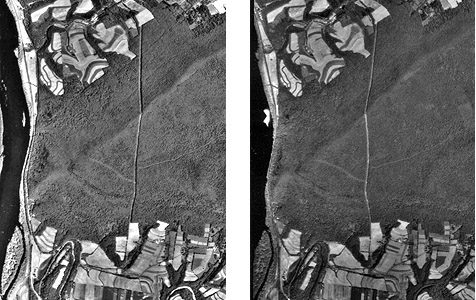
Below are portions of two aerial photographs showing Little Mountain. The two photos were taken from successive flight paths. The two perspectives can be used to create a stereopair.
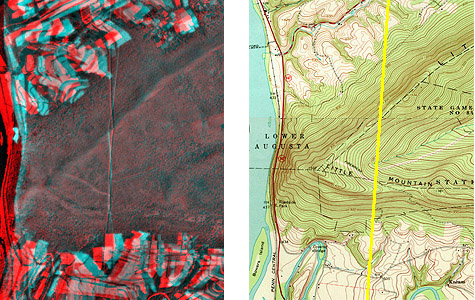
Next, the stereopair is superimposed in an anaglyph image. Using red/cyan glasses, you should be able to see a three-dimensional image of Little Mountain in which the power line appears straight, as it would if you were able to see it in person. Notice that the height of Little Mountain is exaggerated due to the fact that the distance between the principal points of the two photos is not exactly proportional to the distance between your eyes.
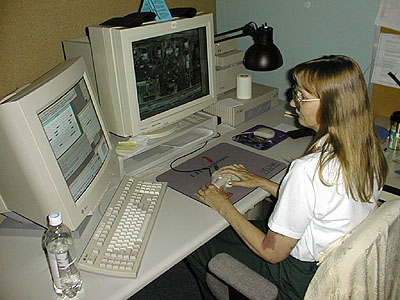
Photogrammetrists use instruments called stereoplotters to trace, or compile, the data shown on topographic maps from stereoscopic images like the ones you've seen here. The operator pictured below is viewing a stereoscopic model similar to the one you see when you view the anaglyph stereo images with red/blue glasses. A stereopair is superimposed on the right-hand screen of the operator's workstation. The left-hand screen shows dialog boxes and command windows through which she controls the stereoplotter software. Instead of red/blue glasses, the operator is wearing glasses with polarized lens filters that allow her to visualize a three-dimensional image of the terrain. She handles a 3-D mouse that allows her to place a cursor on the terrain image within inches of its actual horizontal and vertical position.
7.8.5 Orthorectification
An orthoimage (or orthophoto) is a single aerial image in which distortions caused by relief displacement have been removed. The scale of an orthoimage is uniform. Like a planimetrically correct map, orthoimages depict scenes as though every point were viewed simultaneously from directly above. In other words, they represent the surface as if every optical axis were orthogonal to the ground surface. Notice how the power line clearing has been straightened in the orthophoto on the right below.
Since the early 1990s, orthophotos have been commonly used as sources for editing and revising of digital vector data.
7.8.6 Digital Orthophoto Quadrangle (DOQ)
Digital Orthophoto Quads (DOQs) are raster images of rectified aerial photographs. They are widely used as sources for editing and revising vector topographic data. For example, the vector roads data maintained by businesses like NAVTEQ and Tele Atlas, as well as local and state government agencies, can be plotted over DOQs then edited to reflect changes shown in the orthoimage.
Most DOQs are produced by electronically scanning, then rectifying, black-and-white vertical aerial photographs. DOQs may also be produced from natural-color or near-infrared false-color photos and from digital imagery. Like USGS topographic maps, scale is uniform across each DOQ as a result of the rectification process.
Most DOQs cover 3.75' of longitude by 3.75' of latitude (the ' symbol represents minutes). A set of four DOQs corresponds to each 7.5' quadrangle. (For this reason, DOQs are sometimes called DOQQs--Digital Orthophoto Quarter Quadrangles.) For its National Map, USGS has edge-matched DOQs into seamless data layers, by year of acquisition.
7.9 Summary
This chapter provides a broad introduction to the process of sensing the Earth remotely from satellites and aircraft. Remotely sensed data have become a critical input to our ability to understand the Earth system, to monitor weather and other environmental events, to plan cities and manage resources, to monitor environmental change, and many other applications. Important among the applications is the use of remotely sensed information as an input to mapping the surface of the Earth (its "relief"). Chapter 8: Representing Surfaces will include additional attention to remote sensing and photogrammetry as one of the major tools in the process of representing the surfaces.
Practice Quiz
Registered Penn State students should return now take the self-assessment quiz about Photogrammetry.
You may take practice quizzes as many times as you wish. They are not scored and do not affect your grade in any way.