Module 1 Summative Assessment Overview
Summative Assessment: Concept Mapping and Assessment of Food Systems
First, download the worksheet to understand and complete the assessment. This assignment will require you to draw on your reading of this online text from module one, as well as several options for case studies where we have provided brief descriptions and audiovisual resources (radio clips, videos, photos) that describe these systems. You will accomplish two parts of an assignment that will not only evaluate the learning objectives for module one but will also give you practice in skills you will need to complete your capstone project. These two parts are:
- Draw a concept map of the system that distinguishes between human and natural components or sections of the system (an example is given below)
- Fill in a table that identifies some key components, relationships, and sustainability concerns for this system.
You will complete this assignment for your choice of two food system examples, as described in the detailed instructions below. You will first read, then draw a concept map, and then fill in a table with short responses.
Instructions
- Choose ONE national to global food system example and ONE local to regional food system example from the options that follow this assignment page in the text (see links in outline view at right, or the link to the next page at the bottom of this page). National to global food system examples are Pennsylvania Dairy, Colorado Beef Production, and Peruvian Asparagus, while local to regional examples are the Peruvian smallholder production and New York City greenmarkets examples. Read the descriptions of the system, which may include photos, videos, audio clips, or visiting other websites. Completely read through the description of the two systems you have chosen (one national/global and one local/regional), including these external links before continuing on to the following steps (though you may certainly return to the descriptions as needed). You are welcome to consult other resources online regarding the system you have chosen since that is a skill that will be helpful when embarking on data gathering for your capstone project.
- Using a sheet of paper, or composing in PowerPoint, develop a concept map of only ONE of the systems you chose, subject to the following guidelines:
- Title your concept map with the name of the system you are describing (among the five described on the following pages) and put your name on the diagram.
- Before you begin your concept map, draw a vertical line in your diagram to distinguish between Human and Natural components of the system to right and left, drawing on Fig. 1.2.6, 1.2.7 below, and 1.1.3 (the last one is the concept map example from the guided introductory reading by Colin Sage). However, you do not need to make your diagram look like the highly schematic diagrams in the text of the previous pages (see rather Fig. 1.2.7 below) -- you should include components that are discussed in the examples on the following pages, and connect them in the way that makes sense to you.
- Your concept map should be legible, but it does not need to be extremely neat since it reflects a first attempt to characterize a system. Additional components and relationships will occur to you as you draw, and you may need to squeeze them in. Therefore, leave space as you begin your diagram. If you feel your map becoming too hard to understand, please do compose a second "clean" copy.
- Remember that systems are defined as components and the relationships between them. If you are having trouble thinking of what to draw, think what the components are in the system (these can be boxes or ovals), and then how they are related (these may be labeled arrows)
- Below in Fig. 1.2.7 is an example of a concept map drawn from a food production system producing field crops (wheat, oats, barley, soybeans) and hogs for pork in Western France. Material for this concept map is drawn from Billen et al., 2012, "Localising the nitrogen footprint of the Paris food supply"1
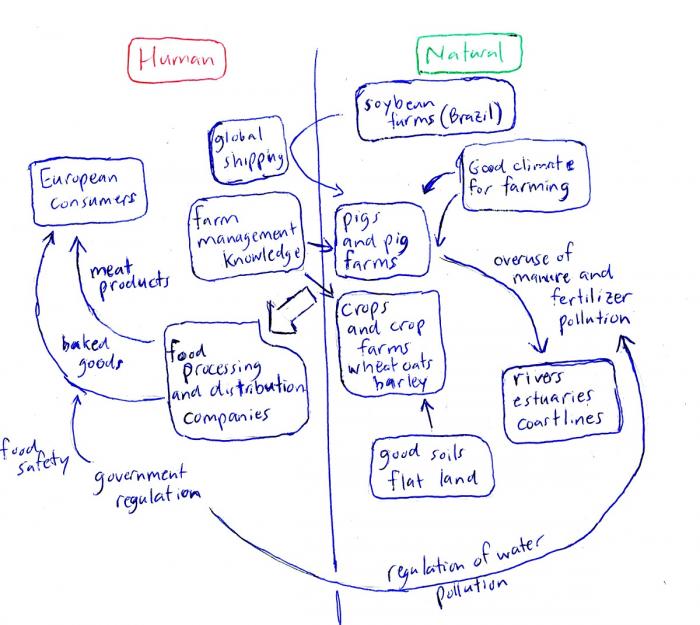 Fig 1.2.7. Example concept map of a food production system, divided into human and natural components.Credit: Sketch by Steven Vanek
- Fill in the table on the worksheet with short answer responses regarding the two food systems you have chosen. The worksheet asks for responses in the following areas:
- Identify two natural components of the food system.
- Identify three human components of the food system.
- Tell how products from the system are transported to markets or to households for consumption.
- Name one sustainability challenge for the system, and state whether it represents a challenge in the area of environmental, social, or economic sustainability.