Terrain through Scale
So far in this course, we have been working primarily with vector data. Though scale is an important consideration in all mapping tasks, working with raster data such as Digital Elevation Models presents a unique set of challenges for data management and design.
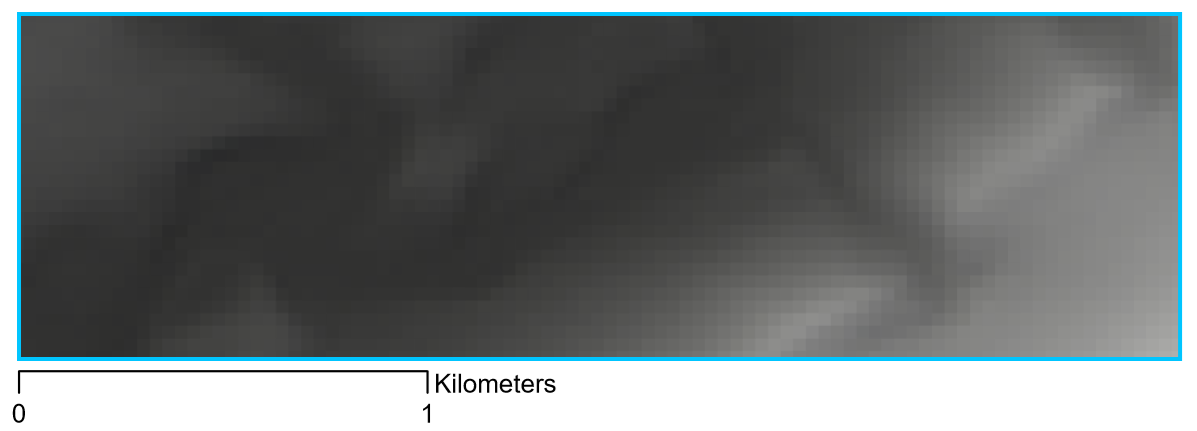
When mapping terrain, it is important to use elevation data that is appropriate for the scale of your map. The image in Figure 6.7.1, for example, appears pixelated and blurry. The resolution of the data used (1-arc-second) is too coarse for creating a clear image at this scale.
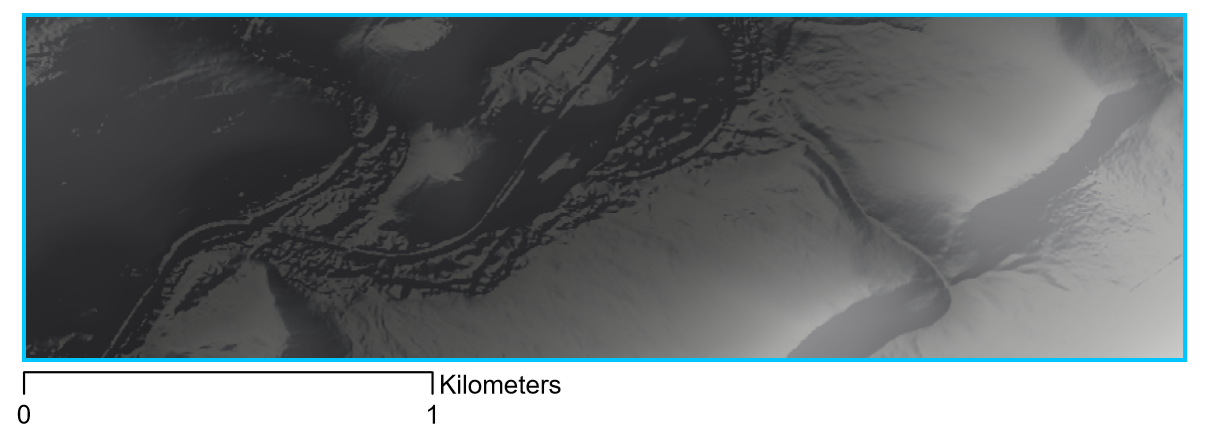
The solution to this is, as you might have guessed, to use higher-resolution data. See, for example, the map in Figure 6.7.2. The scale of this map is the same as in Figure 6.7.1, but the finer-grained data results in a much clearer image.
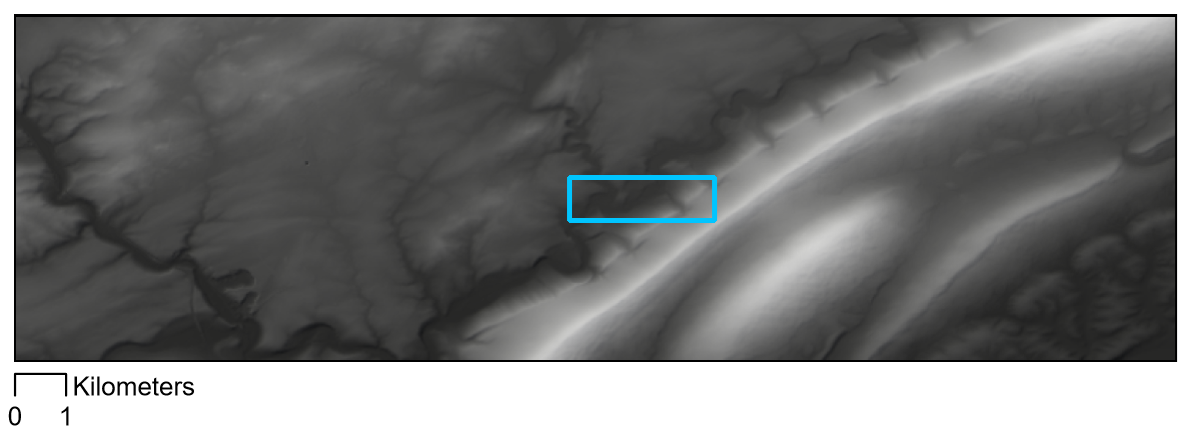
It is important to note that the answer is not to always use the highest-resolution data you can find. The map in Figure 6.7.3, for example, shows a 1-arc-second DEM: the same as used in the blurry image in Figure 6.7.1. At this new scale (1:120,000) this coarser data is quite appropriate. To understand the difference in scale between these maps, note that the extent of the maps above (6.7.1 and 6.7.2) is shown by the blue extent indicator in Figures 6.7.3 and 6.7.4 below.
Raster data is much more space-intensive than vector data, and high-resolution raster data means particularly large file sizes. Using coarse data when appropriate will keep you from unnecessarily filling up all the space on your computer. This is not the only reason for not always using high-resolution DEM data, however. Using data that is too fine for a particular scale can result in undesirable visual effects, similarly to how using data that is too coarse can lead to a very pixelated image. Figure 6.7.4 is an example of a map created with terrain data that is a bit too unecessarily-detailed for its scale.
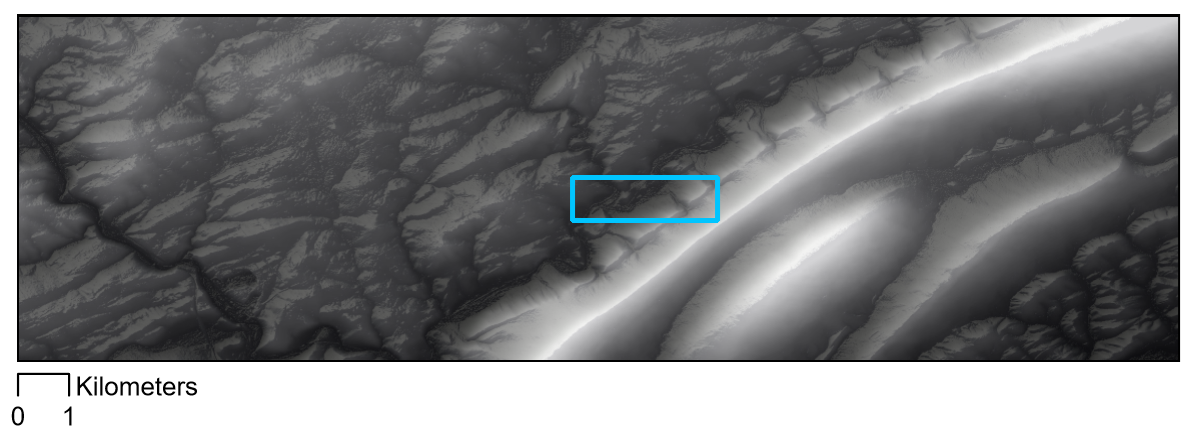
The good news in this second example is that DEMs can be simplified: GIS software can be used to re-sample and generalize terrain data. As with all data processing tasks, however, it is not possible to go in the opposite direction. The only way to create a more detailed terrain map is to collect more detailed data.
Recommended Reading
- Chapter 2: Basemap Basics. Brewer, Cynthia A. 2015. Designing Better Maps: A Guide for GIS Users. Second. Redlands: Esri Press.