Physical Models
The oblique view, when compared to the vertical view, provides a more intuitive view of Earth’s landscapes. However, there is an even more intuitive way to model landscapes—with physical 3D models.
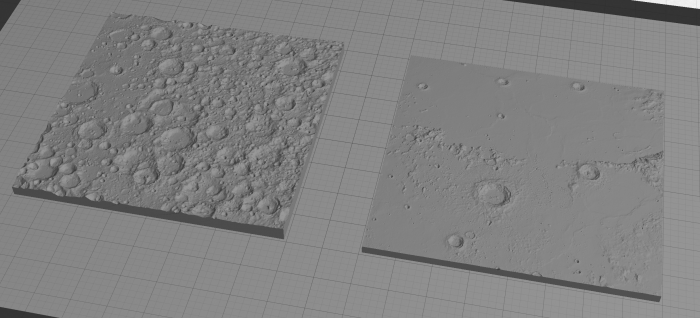
Physical models have been around since the time of the Ancient Greeks, but the time and expense required to create such models has sharply decreased in recent years due to the advent of new computer modeling techniques and 3D printing capabilities (Slocum et al. 2009). This has led, as you might imagine, to a recent increase in the popularity of such maps.
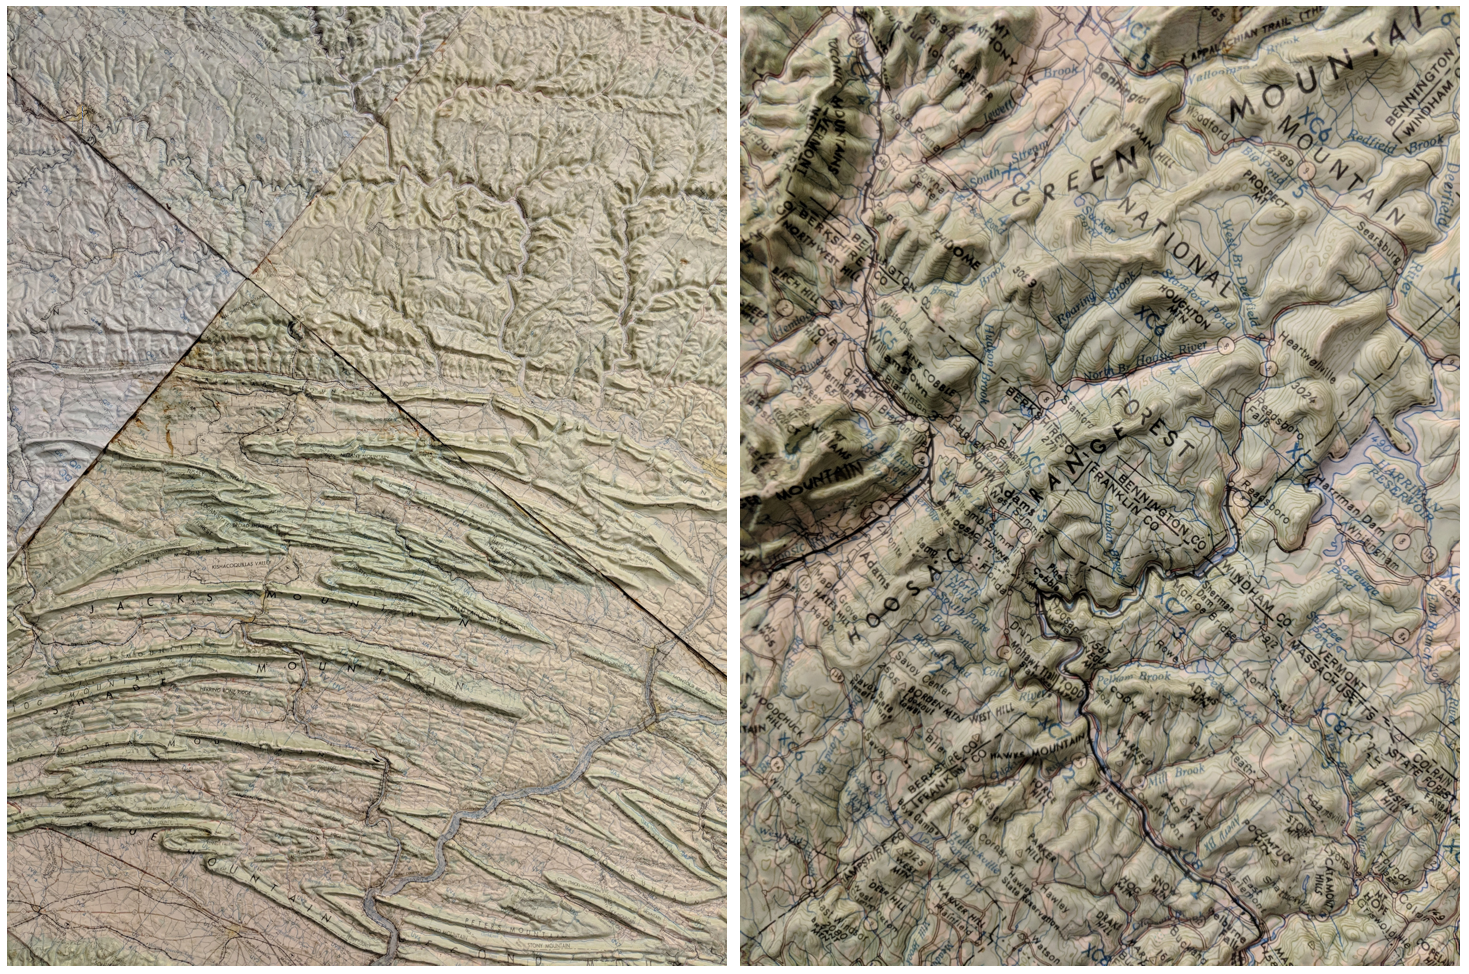
Physical representation can be combined with other terrain visualization techniques. The USGS, for example, produces topographic raised relief maps, such as the one in Figure 6.3.2. These maps combine the contour mapping technique with a haptic representation of terrain—creating engaging as well as useful maps.
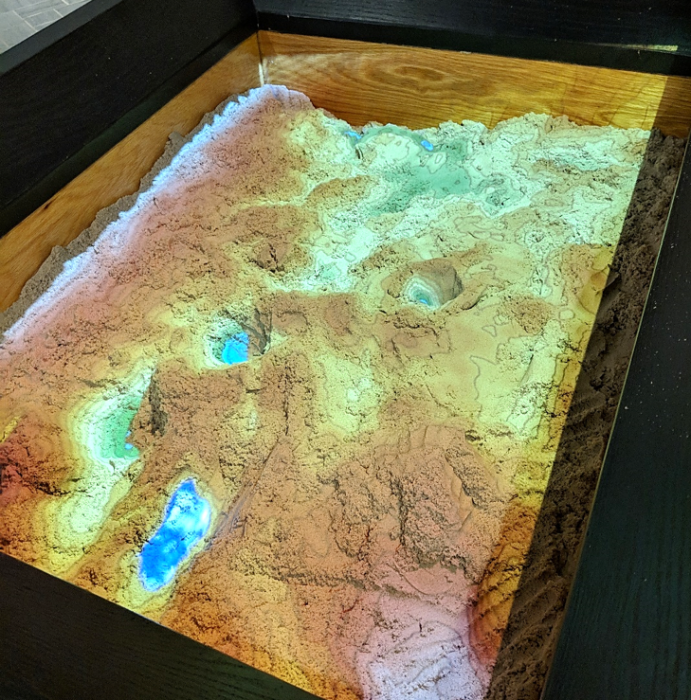
Another new technology, augmented reality (AR), has become popular for creating realistic and dynamic physical models of landscapes. Shown in Figure 6.3.3 below is an augmented reality sandbox, which draws contour lines and hypsometric tints by detecting the shape of the landscape as molded by sandbox-users.
Video Demo!
A similar sandbox is available at UCLA. Watch this video, UCLA's Augmented Reality Sandbox, for an exciting demonstration of this technology.
We will talk more about applications of augmented reality and similar technologies (e.g., virtual reality, mixed reality) later in the course.
Recommended Reading
- Chapter 20: Visualizing Terrain. Slocum, Terry A., Robert B. McMaster, Fritz C. Kessler, and Hugh H. Howard. 2009. Thematic Cartography and Geovisualization. Edited by Keith C. Clarke. 3rd ed. Upper Saddle River, NJ: Pearson Prentice Hall.