Oblique Views
Despite the challenges involved with accurately depicting and visualizing all of the landscape with an oblique view, such views are still useful in some contexts. For some map uses, for example, a detailed view of a small part of the terrain may be more useful than a view from above of a wider area. As with all maps, attention to audience, purpose, and medium is important, and cartographers take these factors into account when deciding how to best represent terrain on a map.
One technique, used commonly in Geology to show underground rock or soil properties, is the block diagram.
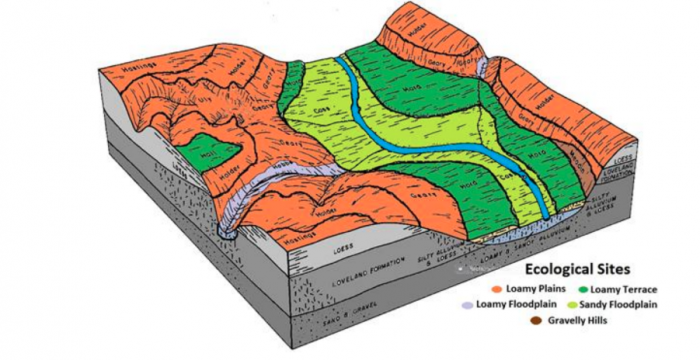
Block diagrams show the surface of the landscape as well as underground structures and materials. This gives them a natural advantage over vertical-view maps if the goal of the map is also to visualize both above and below Earth’s surface. The disadvantage of block diagrams is that they cannot depict all sides of the terrain. In Figure 6.2.1, for example, it is unclear whether the composition of underground materials behind the diagram matches that shown in the front. These diagrams are also more challenging to create than traditional maps, though new software developments continue to make this process easier.
Student Reflection
Imagine viewing a block diagram such as the one in Figure 6.2.1 in an interactive web environment, rather than on paper. How might this alleviate some of the problems caused by the oblique view?
Panoramas are wide-angle views of an area and another popular technique for visualizing terrain. Several maps we saw in the first section, such as Figure 6.1.3, are panoramic maps. The map in Figure 6.2.2 is available from the Library of Congress—if you are interested in these types of historical maps, the LoC is an excellent source to explore.
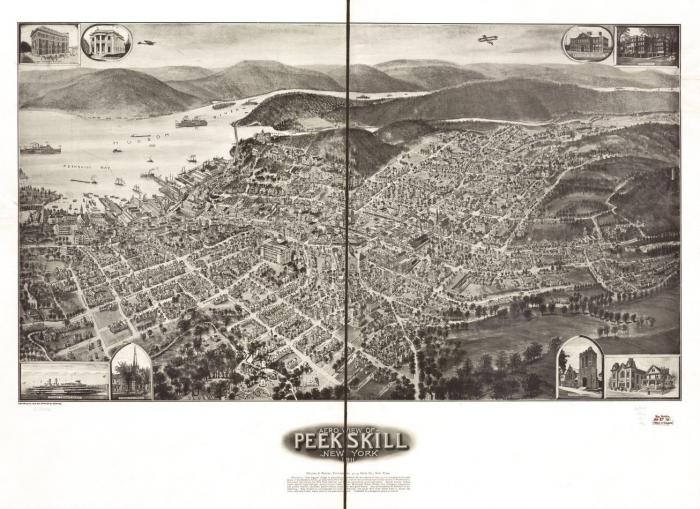
The birds-eye perspective often given by panoramic maps provides an easily-comprehensible view of the landscape to the map user. Hills and valleys, for example, appear as they would to an observer in the real world, and thus their recognition requires no prior knowledge of cartography. Despite this, these maps are uncommonly used for scientific purposes as they do not show a geometrically-accurate view of the landscape.

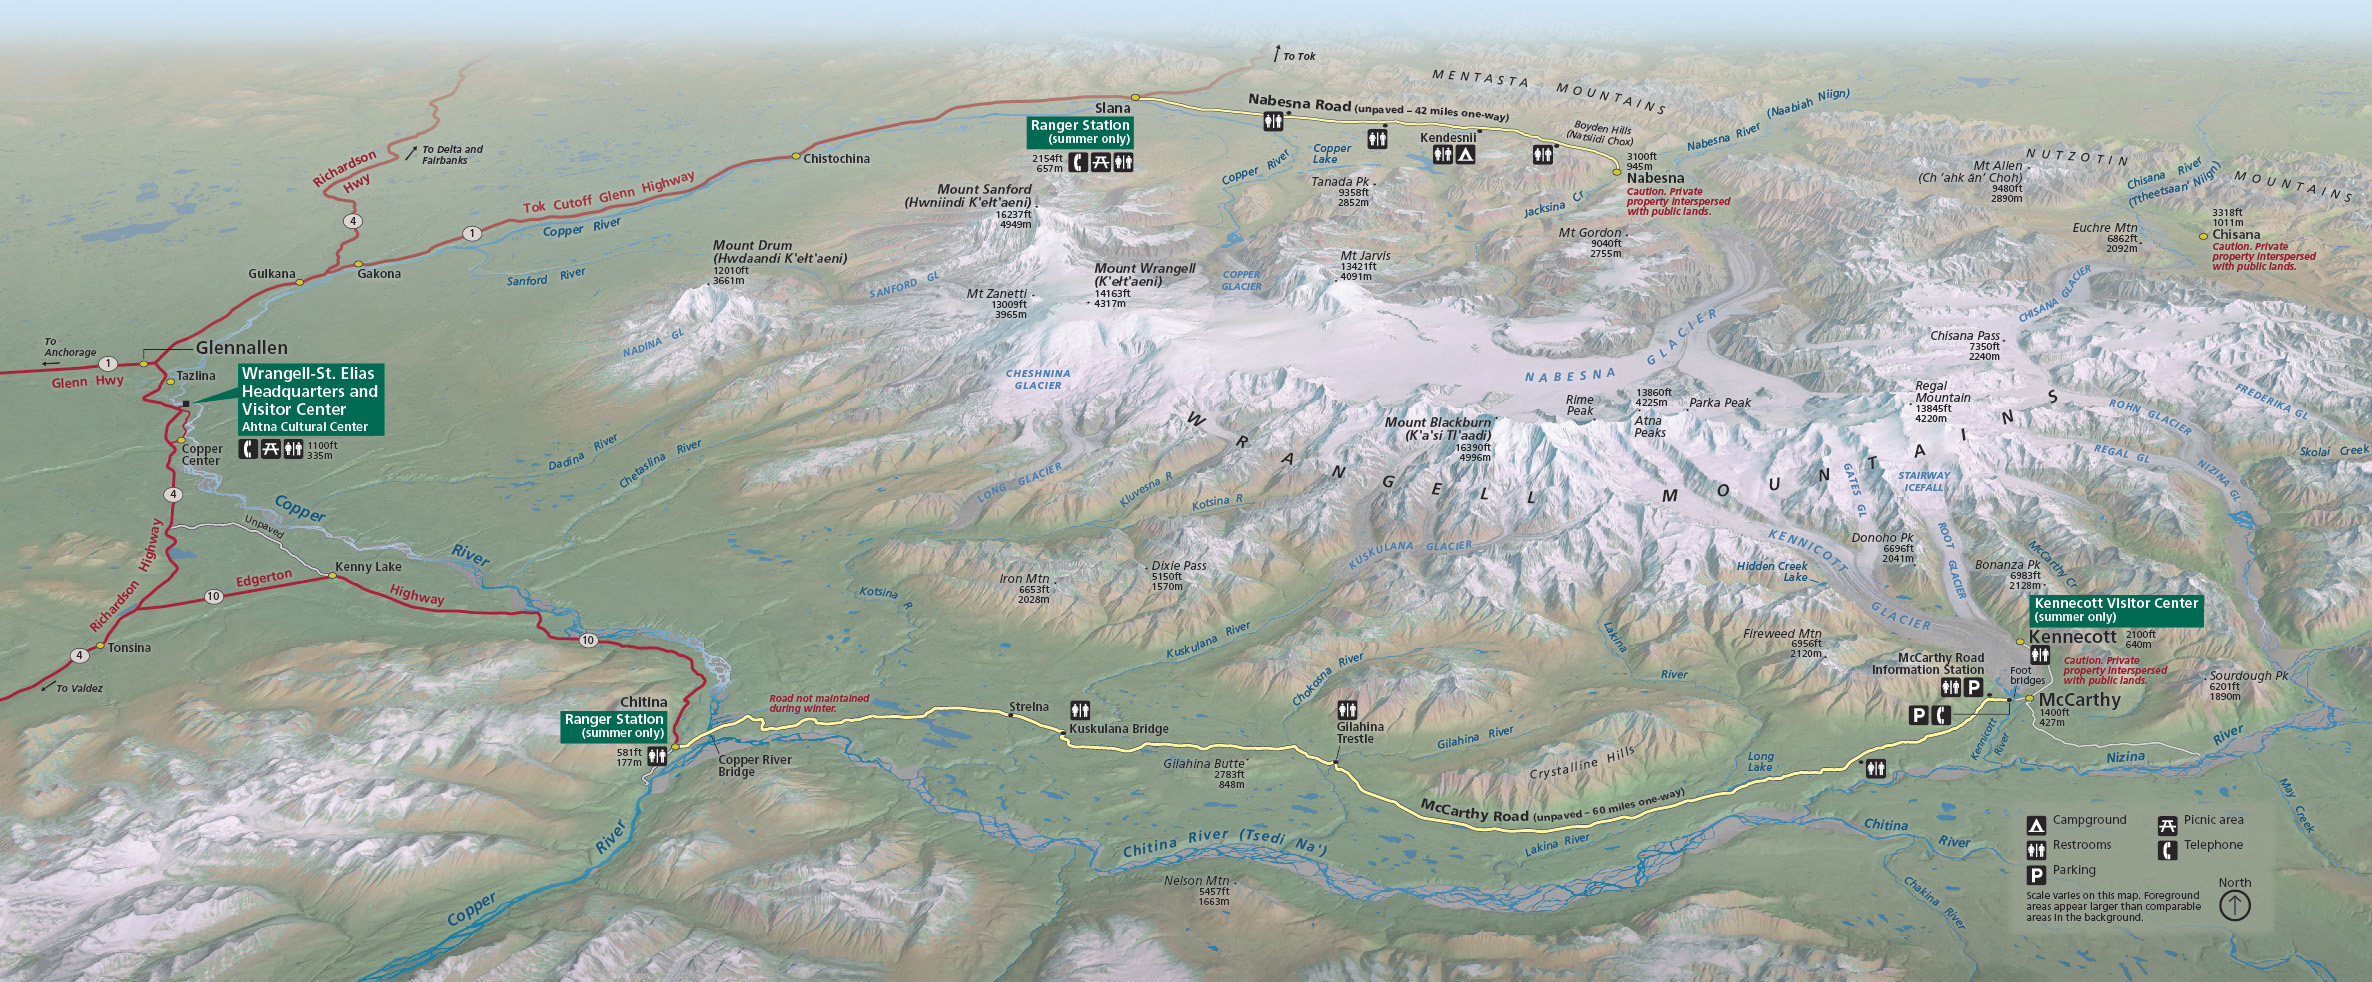
The map in Figure 6.2.3, for example, is a beautiful depiction of the mountains in Wrangell-St. Elias National Park. But if a map reader were to take measurements from this map, they would not be correct. Not only does the oblique view complicate measurement tasks with such maps, but mountain heights are typically exaggerated—not drawn to scale.
Draped images are a form of oblique view maps that have recently become more popular due to the increased availability of satellite imagery and advances in 3D visualization software. They are created by—in essence—draping a remotely-sensed image over a 3D digital terrain model. An example is shown in Figure 6.2.4.
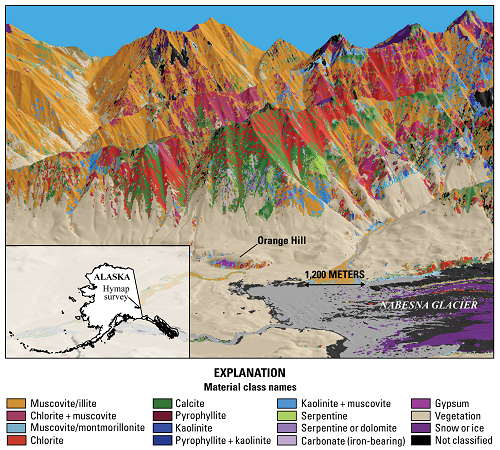
The combination of remotely-sensed data and terrain visualization in draped images can be particularly useful for analyzing a combination of terrain and surface characteristics (e.g., for research on forest fires or ecological suitability).
Recommended Reading
- Chapter 20: Visualizing Terrain. Slocum, Terry A., Robert B. McMaster, Fritz C. Kessler, and Hugh H. Howard. 2009. Thematic Cartography and Geovisualization. Edited by Keith C. Clarke. 3rd ed. Upper Saddle River, NJ: Pearson Prentice Hall. Patterson, Tom. 2018.
- “Shaded Relief.” Accessed November 9, 2018.
- “Relief Shading.” Accessed November 9, 2018.