From the standpoint of climate change impacts, nothing could be more important than the potential changes in Earth's cryosphere — that is, the sea ice, the glaciers, and the two major ice sheets.
Sea Ice
As temperatures warm in the Arctic, the extent of summer sea ice coverage continues to decrease. Ice extent dropped to precipitous levels in 2007. Arctic sea ice seemed to recover in 2008, but then the sea-ice cover decline resumed. In 2012, the area of Arctic sea ice at the end of the summer melting season reached a low of 3.3 million square kilometers (1.3 million square miles), well below the projections of IPCC models. You can read more about the current state of Arctic sea ice in this recent report from the National Snow and Ice Data Center.
© 2015 Pearson Education, Inc.
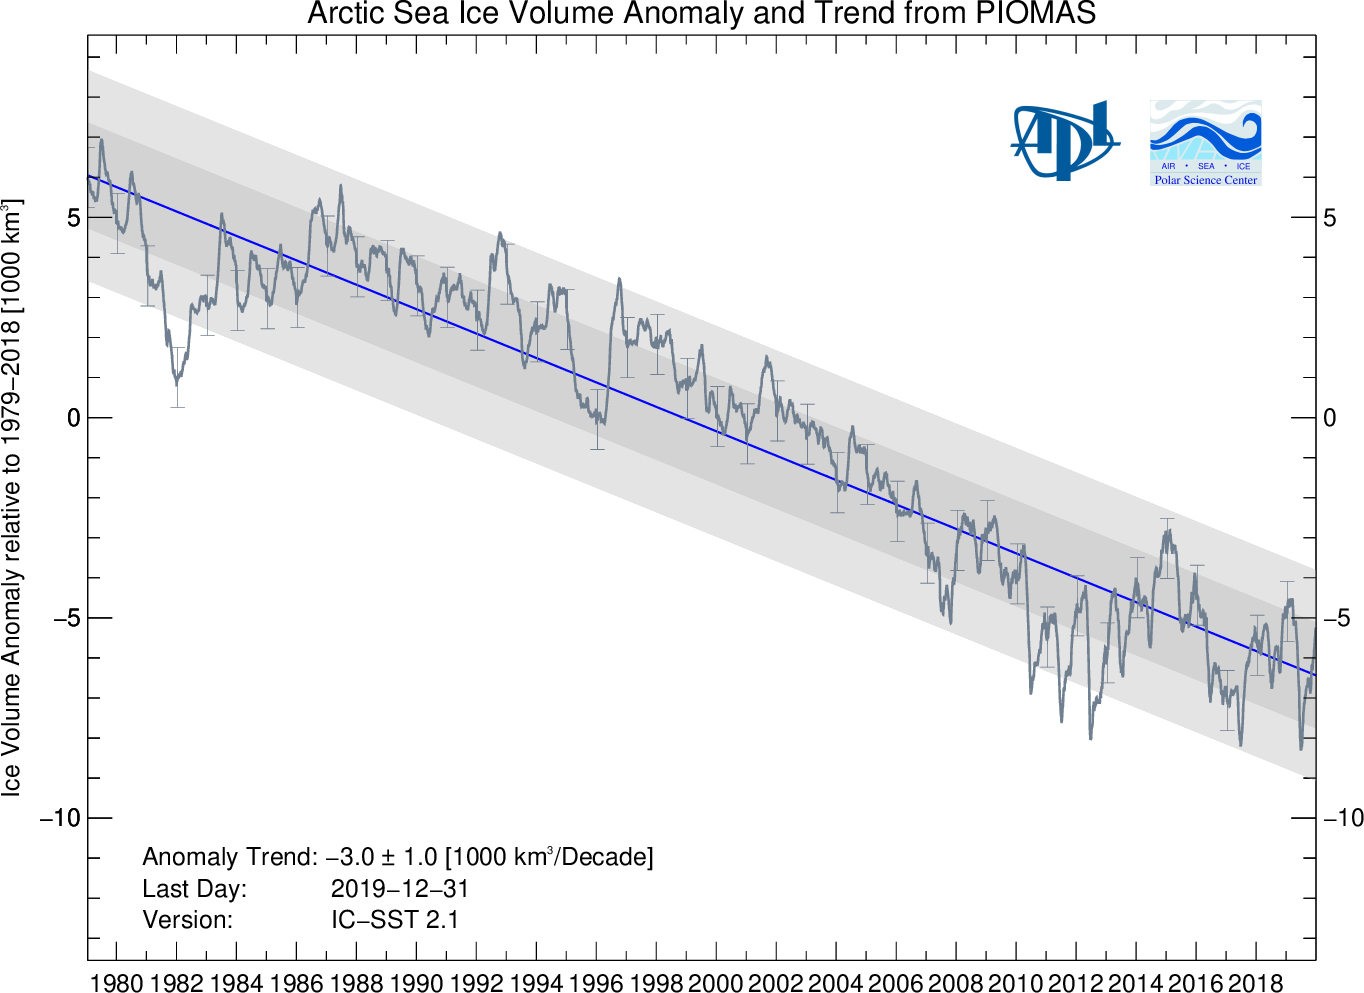
Perhaps more significantly, much of the more resilient, thicker multi-year ice (the ice that survives the summer melt season so that it can further accumulate winter after winter) has disappeared, and the remaining ice is largely just seasonal ice that is far more prone to melting. In fact, when the decreasing thickness, as well as the extent, is taken into account, based on sophisticated computer analyses, the decrease in sea ice volume (the most relevant quantity) is in fact seen to be declining even more abruptly than the extent alone.
As we will see later, the decreases shown by the observations are actually ahead of schedule as far as state-of-the-art climate change projections are concerned. In fact, some predictions based on the observed trends have Arctic sea ice disappearing completely during the summer in as few as a couple of decades.
Glaciers
Mountain glaciers can be found on all of the continents of the world with the exception of Australia. They exist typically at high elevations where the accumulation of snow out-paces the ablation — the loss of ice through melting or sublimation. Because glaciers are vertically distributed, the accumulation and ablation may take place in different locations. For example, the accumulation may take place largely at the apex of a mountain where conditions are cold and most if not all precipitation falls as snow, while the ablation may take place at the periphery of the glacier at lower elevation, where temperatures are high enough, at least seasonally, for ice to melt.
Mountain glaciers have been retreating around the world over the past century. Below are some examples of "before and after" photos demonstrating the dramatic retreat of mountain glaciers in various regions of the world including (top) the McCall Glacier of the Brooks Range in Alaska, (middle) Muir Glacier in Alaska, and (bottom) Qori Kalis Glacier in Peru.
This is primarily because of warming temperatures leading to increased summer melt.
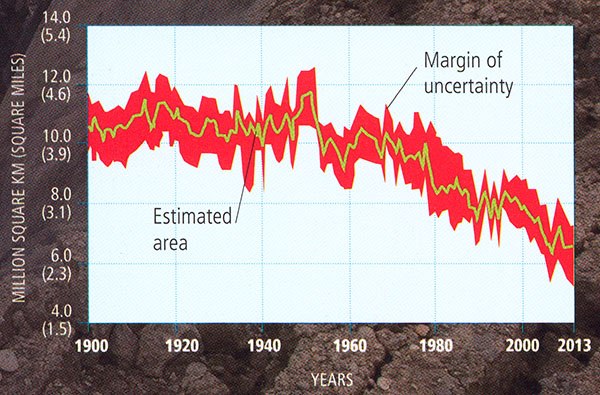
In some cases, the situation is a bit more complicated. Consider for example Mount Kilimanjaro. The iconic glacier fields atop this mountain are essentially located at the equator. This iconic equatorial ice cap was immortalized by Ernest Hemingway during the 1930s in his novel The Snows of Kilimanjaro. Ironically, the snows of Kilimanjaro are disappearing rapidly (see below).
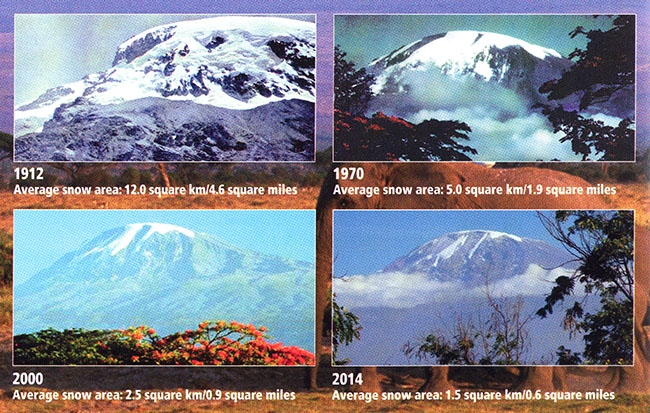
- 1912 - Average snow area: 12.0 km2/4.6 mi2
- 1970 - Average snow area: 5.0 km2/1.9 mi2
- 2000 - Average snow area: 2.5 km2/0.9 mi2
- 2014 - Average snow area: 1.5 km2/0.6 mi2
At the current rate of ablation, Kilimanjaro's ice fields will be gone within the next two decades. Is this imminent disappearance due to global warming? Well, Kilimanjaro's ice fields have been around for at least 12,000 years. It would seem quite a coincidence, therefore, that they just happened to choose to disappear now. However, it isn't quite as simple as one might imagine. Melting is probably not the primary process responsible for the ablation of the ice. At this altitude of nearly 6 km (placing it in the mid-troposphere), the primary mechanism by which ice is lost is sublimation, not melting. Moreover, as with many tropical glaciers (see e.g., this article on Tropical Glacier Retreat at the site RealClimate.org), changes over time in the overall mass balance are heavily influenced by accumulation (i.e., the amount of snowfall), not just melting. Some have argued, for these reasons, that the rapid disappearance of Kilimanjaro's ice cap cannot be blamed on human-caused climate change. That argument is probably wrong, however. While changes in humidity and precipitation have clearly played a role in decreasing accumulation, these changes may in part reflect the large-scale reorganization of the atmospheric circulation that is tied to human-caused climate change. Moreover, some direct melting of Kilimanjaro's ice fields has been observed in recent decades, and that melting is almost certainly part of the picture. Such increases in melting have been observed for high-elevation mountain glaciers throughout the tropics, and are tied to large-scale warming of the tropical mid-troposphere that appears to be connected with the larger-scale pattern of a warming troposphere.
Now, there are some exceptions to the pattern of widespread global glacial retreat. See the map below. Certain outlet glaciers in Scandinavia and the Pacific Northwest have actually expanded in extent in recent decades.
Think About It!
Why do you suppose that expansion is taking place in some locations? [Hint: what do those regions have in common?]
Click for answer.
Winters are quite mild in these maritime regions, and the winds coming off the relatively warm North Atlantic pick up large amounts of moisture before they encounter the continent. When the winds rise up over the coastal mountain ranges, that moisture precipitates out as snow.
A warm winter will typically lead to even greater amounts of snowfall. Counter-intuitively, mountain glaciers can actually expand in these regions as winters warm, which they indeed have in these regions!
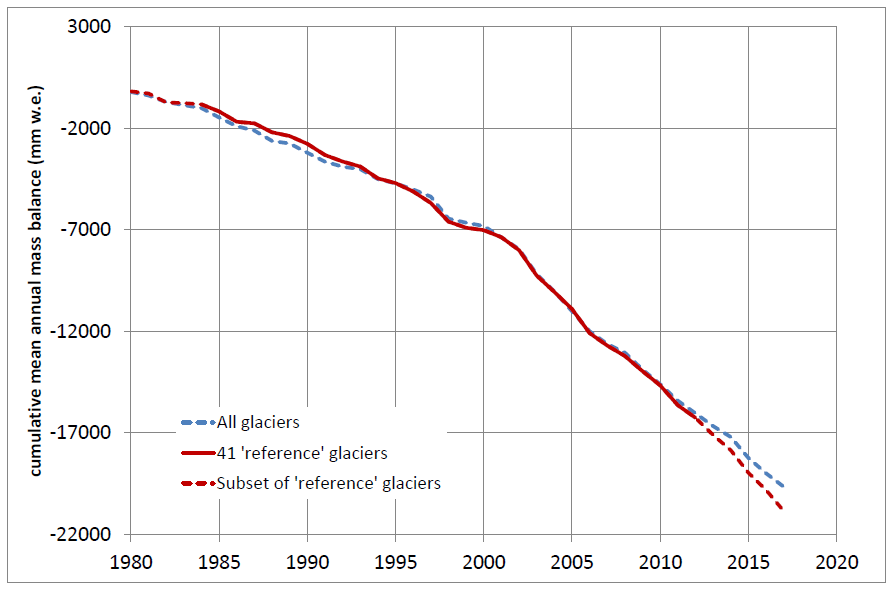
If we aggregate all of the major glaciers around the world into a single estimate of 'mass balance', i.e., the net change in ice mass which represents the balance between accumulation through snowfall and loss through melting and sublimation, we find a pronounced trend towards decreasing glacial ice mass, which in many respects mirrors the loss of sea ice shown earlier. However, unlike melting sea ice which does not contribute to global sea level rise (because the ice is already floating on the ocean), the melting glaciers do make a significant contribution to rising global sea levels — a topic we address below.
Ice Sheets
While we have seen that the world's glaciers are melting en masse, and at an accelerating rate, we have not yet addressed the behavior of the two largest glaciers in the world — glaciers that are so large, we call them continental ice sheets. There are two continental ice sheets — the Greenland ice sheet and the Antarctic Ice Sheet. In reality, only a portion of the Antarctic ice sheet is susceptible to collapse. The East Antarctic ice sheet sits at a relatively high elevation and is relatively stable. It is unlikely to disappear under most projected climate change scenarios. However, the lower elevation West Antarctic ice sheet is likely susceptible to mass wastage.
The mass of the major ice sheets, like that of smaller glaciers, depends on the balance between accumulation and loss to ablation. Also, as with smaller glaciers, the regions of accumulation and ablation are typically not the same. The primary accumulation is in the colder interiors of the continents, while ice flowing out towards the periphery at lower latitudes is subject to melting and the calving of ice into the ocean. In the case of the Greenland ice sheet, fissures known as moulins may form, allowing meltwater to percolate to the bottom and help lubricate streams of melting ice that escape to the ocean in ice channels. In the case of the Antarctic Ice sheet, ice calves into the southern ocean at the periphery of expansive ice shelves that extend out over the relatively warm ocean.
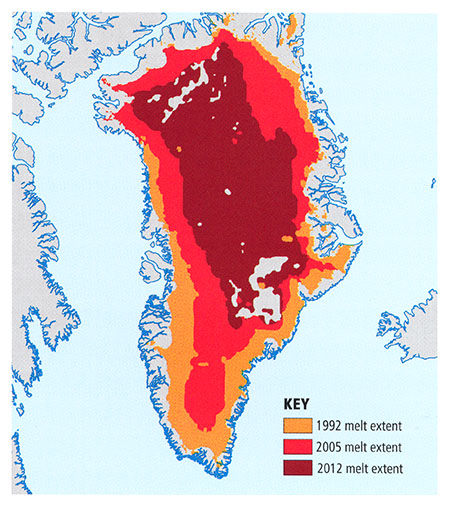
Because of the complex balance between the processes favoring accumulation and ablation, it was not known for some time whether the observed warming of the globe had in fact led to any net loss of ice mass for either of the two continental ice sheets. In recent years, however, careful satellite measurements have suggested that detectable changes are indeed underway. The area of summer ablation over Greenland, for example, has expanded greatly in recent years (see figure below).
© 2015 Pearson Education, Inc.
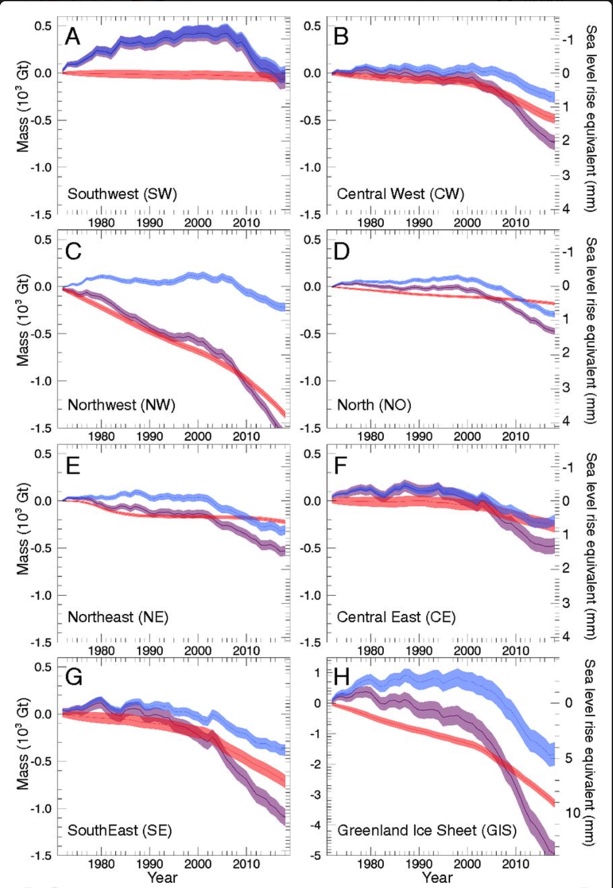
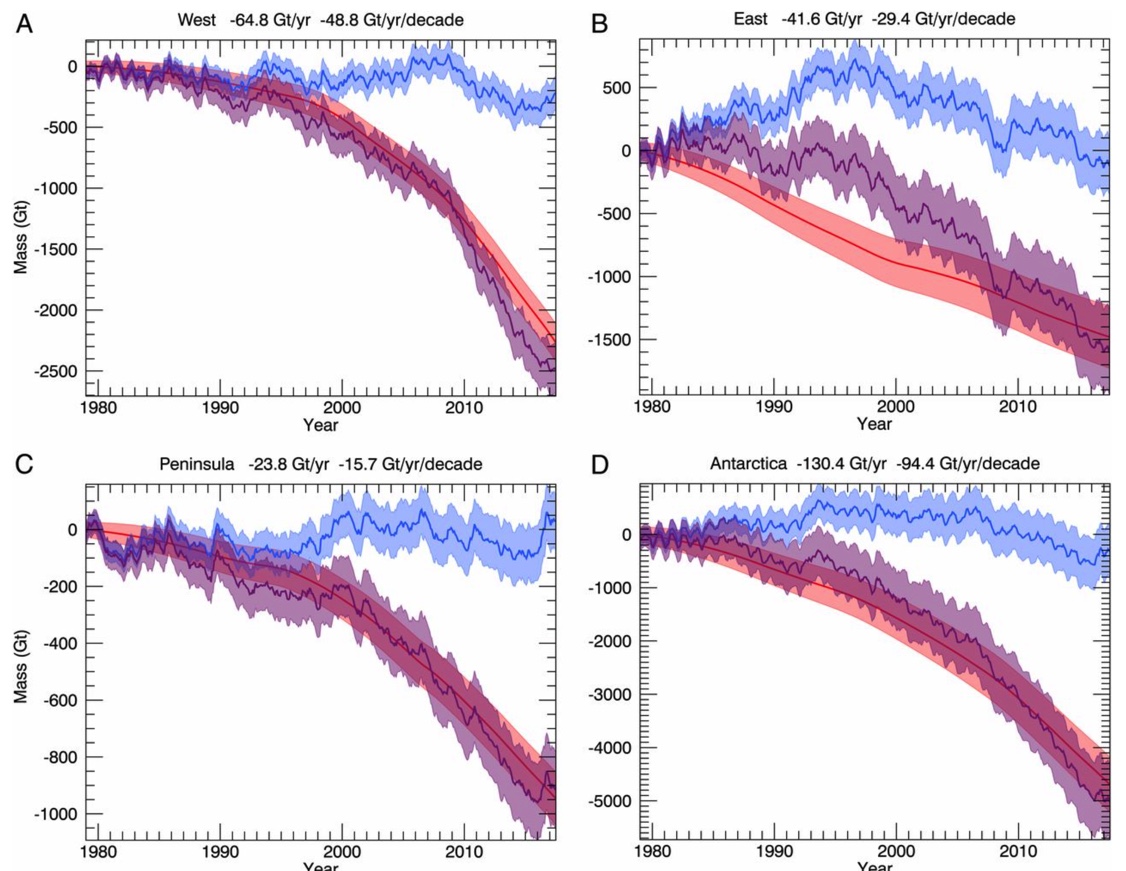
Figure 3.9: Changes in Ice Mass for the Antarctic Ice Sheet over Past 40 Years.
Credit: Riguot et al. (2019), PNAS
Global Sea Level
We have seen that the world's ocean surface is warming. Indeed, as we will see later in this lesson, that warmth is slowly penetrating down into the deep ocean. As ocean water warms, it expands, and thus contributes to raising sea level. We refer to this component of global sea level rise as the thermosteric component. But there are other key contributions of global warming to global sea level. In fact, we've just discussed them above: the melting of glaciers, and the loss of ice mass now underway for both of the two continental ice sheets.
The latter contribution exceeds the expectations scientists had just a few years ago, before there was any consensus that the decay of the Greenland and West Antarctic ice sheets was likely to happen in the near future, let alone already be underway. Not surprisingly, we are observing that global sea level rise is proceeding at the very upper extreme of the range that was projected by the models just a couple decades ago (see below).