Hurricane Formation
Tropical cyclones are storms that are born in tropical oceans and depend on warm water for their source of energy. They originate between 4° and 22° S of the equator, and between 4° and 35° N of the equator. During the northern hemisphere’s summer (July-September), most of the energy is delivered to the sub-tropical region of the northern hemisphere. The result is the development of large cyclonic (counterclockwise rotating) cells that are termed hurricanes if they form near North America and typhoons if they are formed in the western Pacific. Tropical cyclones do not, however, occur in the equatorial zone. More than two-thirds of tropical cyclones occur in the northern hemisphere and occur between May and November, when the ocean is at its warmest, with a peak in August and September. In the southern hemisphere, they occur between December and April, with peaks in January and February, where they are typically called cyclones.
We generally associate tropical cyclones with the damage they do when they come in contact with land, but they spend most of their “life” out in the ocean and are a phenomenon best explained in terms of heat transfer between the atmosphere and the ocean.
The Birth of a Cyclone
The generation of a tropical cyclone is dependent upon the transfer of thermal energy from the ocean to the atmosphere. When significant volumes of warm water vapor move upwards, low-pressure cells develop at the Earth's surface and large storms are generated. In the process, water vapor evaporated into the atmosphere will cool and condense. This is ultimately how storm clouds are produced. As the water begins to fall back to the surface, large scale convective cells are generated, and the air mass is forced to spin in response to the Coriolis Effect. This causes deflection of air masses to the right in the northern hemisphere and deflection to the left in the southern. For storms to sustain themselves, the upward movement of warm water vapor needs to be constantly resupplied or the storm will weaken and eventually fall apart. The video beelow explain how a hurricane forms and outlines its anatomy:
Video: Hurricanes 101 | National Geographic (2:57)
(heavy winds blowing) - [Narrator] Cyclone, typhoon, hurricane. All of these names are used around the world to describe the most powerful storm known to man. Hurricanes are unpredictable but scientists have a thorough understanding of how hurricanes form and sustain their power.
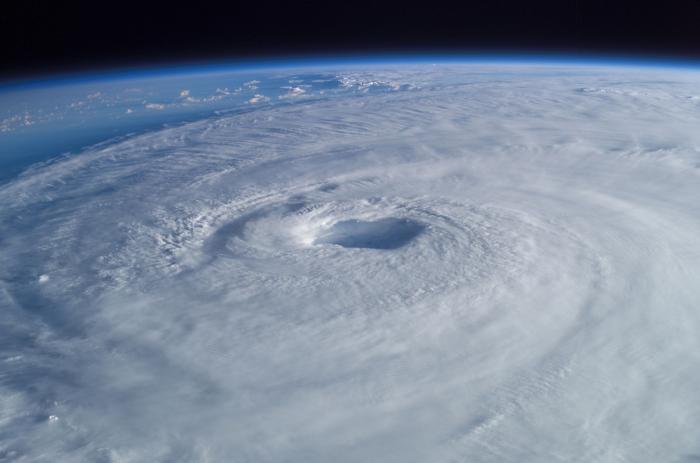
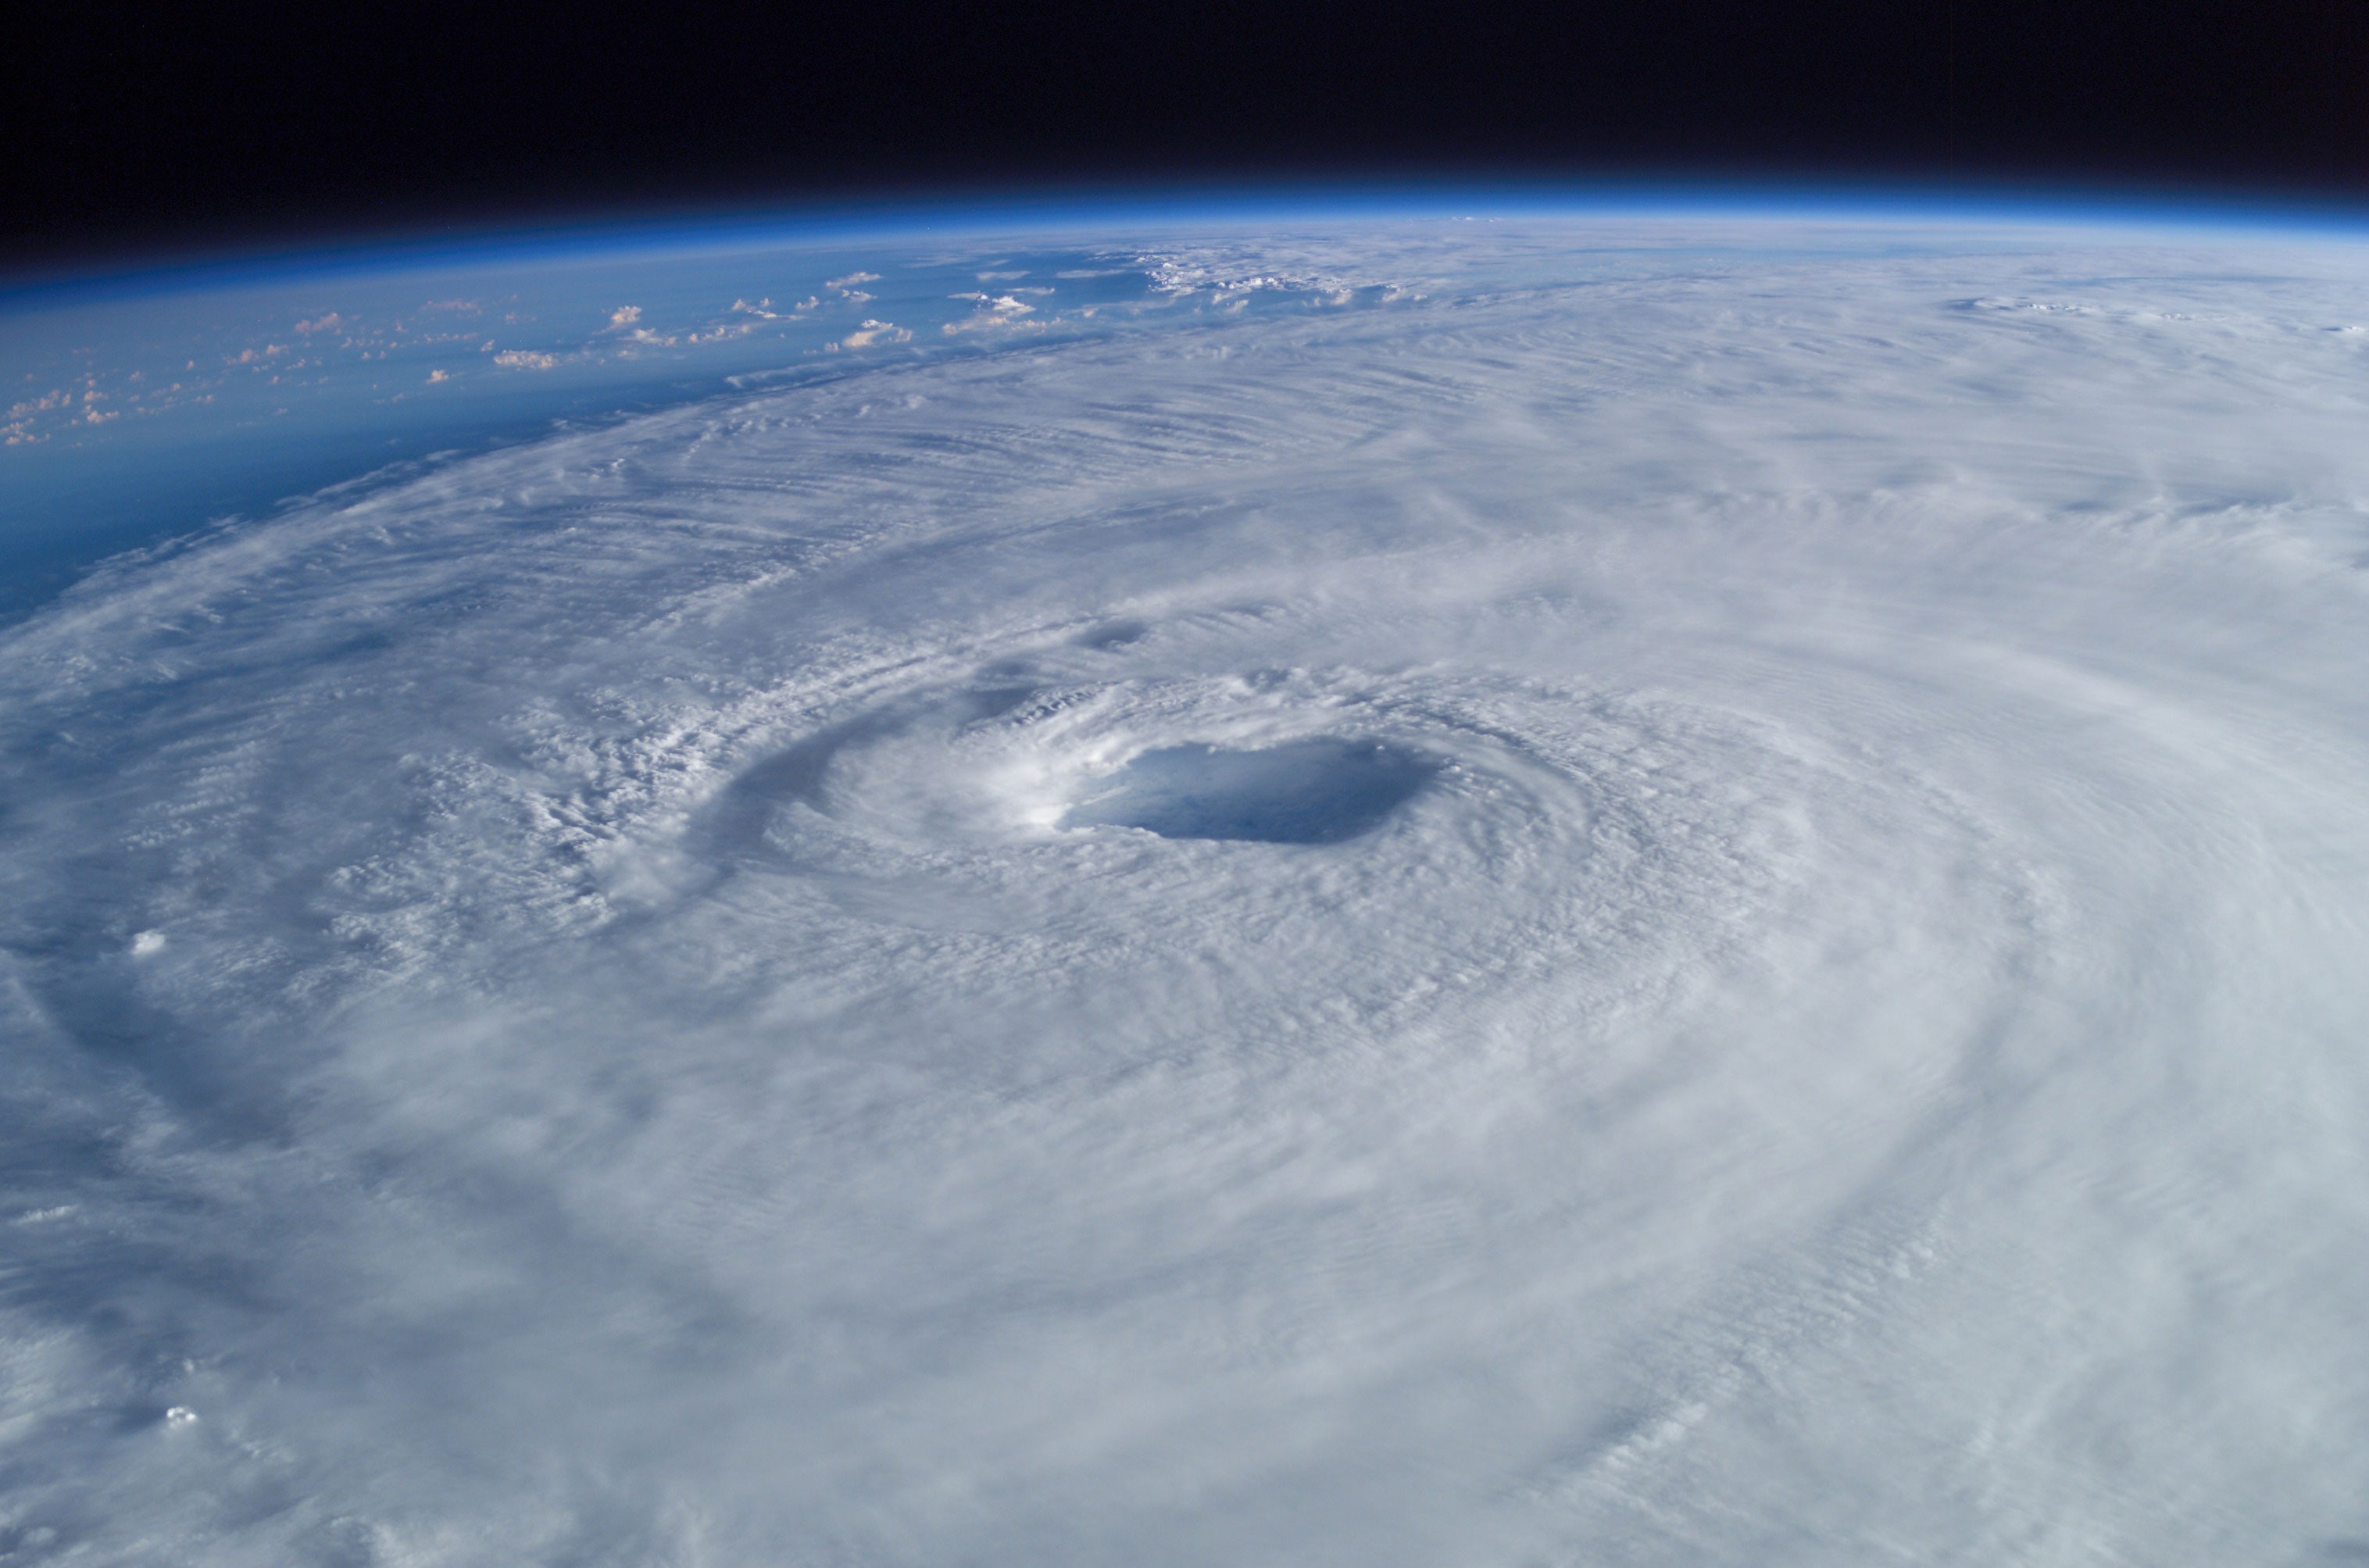
In the Atlantic Ocean, hurricane season peaks during the late summer months when tropical waters are the warmest. Hurricanes form from a cluster of thunderstorms that suck up the warm, moist air and move it high into Earth’s atmosphere. The warm air is then converted into energy that powers the hurricane’s circular winds. These winds spin around a low-pressure center called the eye, which can provide a 20 to 30 mile radius of eerie calm. Encircling it is the eye wall, a towering ring of clouds with some of the fastest wind-speeds of the hurricane. Surrounding the eye wall are curved bands of clouds, the rainbands, often tens of miles wide, releasing sheets of rain and sometimes tornadoes.
When a tropical storm’s winds reach at least 74 miles per hour, it becomes a hurricane. The hurricane then receives the category ranking of one to five on the Saffir-Simpson Scale based on its wind speed and potential damage. But wind speed isn’t always the most dangerous component when hurricanes come near land. It’s storm surge. Storm surge is caused when winds from an approaching hurricane push water towards the shoreline up to 20 feet above sea level and can extend 100 miles. 90% of all hurricane deaths are the result of storm surge.
While hurricanes can cause mass devastation, just like other natural disasters, they serve a higher purpose within the global ecosystem. Hurricanes help regulate our climate by moving heat energy from the equator to the poles, keeping the Earth’s temperature stable. Over time, science has helped us to better understand hurricanes and predict their paths, saving lives through early warning systems and helping us build better infrastructure to protect our cities. The more we study these complex storms, the better we can prepare for them and minimize their impact on human lives.
How a hurricane develops: Hurricane Facts
For a tropical cyclone to generate, the temperature of the upper 60 meters (~200 ft.) of the ocean water must be greater than 26°C (~79°F). In addition, certain atmospheric conditions are needed to drive the formation of convection cell described above. Horizontal shear winds prevent formation; conversely, in conditions with low wind shear, heat and moisture are retained to allow continued development. The building of the tall cumulonimbus clouds associated with a tropical cyclone depends on the deep convection currents extending into the troposphere. The initial anomaly is called a tropical wave, and then with progressive intensification, it is called a disturbance, an investigation (where it is given a number), then a depression, tropical storm, then a hurricane. This is explained in the following video:
Video: The Basics of Hurricanes and Tropical Weather Forecasting (8:07)
Alan Sealls: I’m chief meteorologist Alan Sealls and let’s talk about hurricanes and hurricane season. It comes around every year, starting on June first, ending on November 30th. And the peak of hurricane season is basically late August into September. Now, these are averages. Hurricane seasons typically start pretty quietly in the Atlantic Ocean, but then as the ocean heats up, that’s when you see more activity — whether it’s a tropical depression, a tropical storm, or all these other things. So you have to know your hurricane vocabulary. I think most people know the hurricane. That’s the big storm. That’s the one you don’t want. A tropical depression tends to be the weaker storm, but it could be a big slow rainstorm, but beneath that, you have all these other things. For example, tropical waves, tropical disturbances, and invest or investigations. It turns out the stuff on the top, that’s less frequent. You typically get no more than half a dozen hurricanes in the Atlantic each year, but that’s also a higher threat, so small number big threat. Down at the bottom, a larger number but smaller threat.
So, take it one by one. A tropical wave — it’s a region of low pressure in the tropics that moves from east to west. It’s just low pressure. But within a tropical wave, if you have thunderstorms that travel as a group, as a cluster, and they hold together, it’s called a tropical disturbance. Now, if that disturbance looks like it may form into something, it’s known as an invest. In other words, it’s being investigated to see if it will develop any further. It will have a number, but that number is not the same as the number a tropical depression or a tropical storm would get. So we show you a lot on TV, you’ll see it on social media, these lines representing computer models. They’re known as spaghetti plots. It’s the nickname, but they do look like strands of spaghetti. Doesn’t matter if it’s a tropical storm, or a hurricane, or even a tropical depression, those model plots show where the center of that storm could be in the future. But it’s actually the basis for creating the forecast cone.
Here’s how it works. You start with the system that’s moving to the west and in time, if you look at where most of those spaghetti plots are, you draw a circle. That is your forecast area, and it’s relatively small to start because you’re pretty certain it’s going to move in the same direction. However, in time, as the model spreads apart, your circle gets bigger. In other words, you are less certain. The farther out in time you go, the less certainty you have. So you take all those forecast circles, and you connect the edges of them and that’s what creates the forecast cone. But there are a couple of things about the cone people don’t realize. The forecast cone is only for the center of the storm. It’s not to say, if it’s a hurricane, for example, that the hurricane stays in here, it means the center could track along the northern edge of it, or the southern edge, or right through the middle. But even if it does that, the impact could still be well outside the cone. Another really important thing to know — the cone, as it’s a forecast, it’s not certain, it’s not definite, and statistically, one-third of the time the center of the storm will go outside the cone. It may come back into the cone, but it’s not perfect. It is only a projection. So again, it’s based on, mostly spaghetti plots from multiple models, indicating where a storm could be. But they don’t indicate the strength of the storm, they only indicate the path.
Take a computer model. You’ll see dozens of these online now. They use math and physics, calculus, to compute and project what’s going to happen. And if you think about watching an animated movie, when you watch animated figures, they’re never truly perfect like humans. Same thing with computer models. They are never perfect, but they start with the basics of temperature, pressure, humidity, and wind at multiple levels in the atmosphere, and over a thousand, tens of thousands of square miles. They also account for water temperature and some account for how salty the water is because that will control the rate of evaporation. That also controls whether the warm water will stay at the top or whether it may overturn and sink. So these are just some of the variables that go into computer models.
So you take all that and the problem is, getting it is difficult. When a storm is out to sea, the only thing we have is a satellite to let us know that something is out there. There are ships that will pass storms, but they purposely go away from them. But ships can give us data, buoys can give us data, but there aren’t that many buoys in the Gulf, in the Atlantic, in the Caribbean. And when it gets near shore, we can use radar. Don’t forget weather balloons, those go up into the air, but you have to launch them basically from land. But there are multiple aircraft that fly out into the ocean and drop instruments into the ocean, into the clouds, into the storm, to take measurements. C-130 aircraft, p3 Orion, a Gulfstream 4 jet, and that one on the top that’s an unmanned UAV, unmanned aerial vehicle, also known as a drone. NASA uses it. And those things, it’s known as the Global Hawk, they go out into the ocean stay out there for a long time, dropping instruments for weather information.
So, you take all that stuff, what does it take to get a hurricane? It actually takes a lot more than you might think. It’s not just warm water. First of all, you have to have air that is fairly unstable. You’ve got to have clouds, which tells you that the air is cooling as it goes up, the relative humidity hits 100 percent, you get the clouds forming. But you’ll also have air that’s going up and down, up and down, which we call convection, and that’s what we get daily in the summer onshore. Thunderstorms, they’re due to convection. If you have a convection oven, you know the air is going up and down, in all different directions. Along with that, about 3 miles above the surface of the ocean, you need relatively moist air and that’s what will help those thunderstorms last and persist. But one thing you can’t have is too much wind shear. In other words, if the winds are light near the surface of the ocean, and you go up a few miles, and they’re too strong, the clouds will fall over they’ll get shredded apart. So you won’t start to get development. You need light wind shear to get tropical systems to develop. And of course, warm water, everyone knows that part. And yes, the Gulf, the Caribbean, the Atlantic, they get really hot in the middle of the summer. The Sun beats down on them constantly, the oceans heat up, you take that heat, you take the light wind shear, you take a tropical wave, you take a tropical disturbance, and if you can get a circulation, if you can get the wind circulating less than say 39 miles per hour, it would become a tropical depression. Now, at that point, it gets a number. Once the winds exceed 39 miles an hour, it would be classified as a tropical storm and given a name. You could have a tropical storm with 40 miles an hour, or 70 mile an hour winds, and even though those winds are not as strong as what you would see in a hurricane, which are basically 75 miles and up, still it could be a bad system in terms of rainfall and in terms of what it could spawn for tornadoes. So when you look at hurricanes with winds over 74 miles an hour, and the strongest hurricanes winds over 150, it’s the forward right quadrant that’s the worst. So if this is moving north, it would be that forward right quadrant that would have the most impact. And those bands feeding into that quadrant, that’s where you would be most likely to find tornadoes, at least on the northern Gulf Coast.
So what about the names of these systems? They’re alphabetical A through Z, except you don’t use the letters Q, X, Y, and Z because there aren’t that many names that start with those letters. The lists are already designated and they recycle every six years. They’re not created by the US government, they’re created by the World Meteorological Organization, simply because tropical weather impacts multiple countries, multiple nationalities, and languages, so we can’t just use names that we would be used to in the United States. To be fair, the names do alternate male and female. So that’s just a little primer on hurricanes and the tropical season. But it’s all about being prepared. Even early in the season, you can have a system, even outside of the season, you can have a system. I’m chief meteorologist Alan Sealls.
Anatomy of a Hurricane
There are distinct stages of formation that vary greatly from storm to storm. As the pressure drops in the center of the storm, the winds that rotate around the center increase. Narrow cloud bands form, spiraling inwards. The center of the storm, or the eye, is where the lowest pressure is found. The eye wall at the edge of the eye has some of the strongest winds and intense thunderstorms, but the eye itself is characterized by calm. The hurricane-force winds may extend out from the eye for 300 km (~186 miles). The strongest winds occur towards the right-hand side of the center in the direction of the cyclone’s path, so a storm moving north will have the strongest winds in the northeastern quadrant.

Hurricane Tracks and Forecasting
Hurricane movement is guided by surface winds. As we will see in the examples given, the Atlantic hurricanes travel west or northwest across the Atlantic and then recurve to the north and then northeast. This curvature is dictated by the Coriolis effect, which is caused by the Earth’s rotation. This pattern also occurs in the northern Pacific. Although these are predictable patterns, each storm has a unique path and there is great variation depending upon the atmospheric conditions near the storm, which act as steering forces. As we will see later wind movements are a function of atmospheric pressure, with storms basically moving around high pressure systems and towards low pressure systems.
Nevertheless, the patterns made by the historic tracks seen in the animation below show how the storms generally follow certain rules. This predictability aids in forecasting the paths using satellite data and numerical modeling.
Video: Hurricane Tracks Animation and Cumulative Map (0:14) (Video is not narrated.)
The cyclone’s interaction with the ocean’s surface has an effect of reducing the surface temperatures of the ocean. Once the storm approaches land, it encounters shallower water and begins interacting with coastal features. Friction and loss of the warm water “fuel” remove energy from the system, and it will dissipate once over land. It is at the ocean-land interface that the storm surge, which builds with the storm in the ocean, creates a tremendous hazard for those living on the coast.