Sea Level in the Past 200,000 Years
Let’s look at how sea levels have changed over the past 200,000 years of Earth’s history, based on evidence provided by paleoclimatology.
Probably, the factor that influences sea levels on the planet more than any other is the proportion of the Earth’s water that is in the form of ice at any point in time.
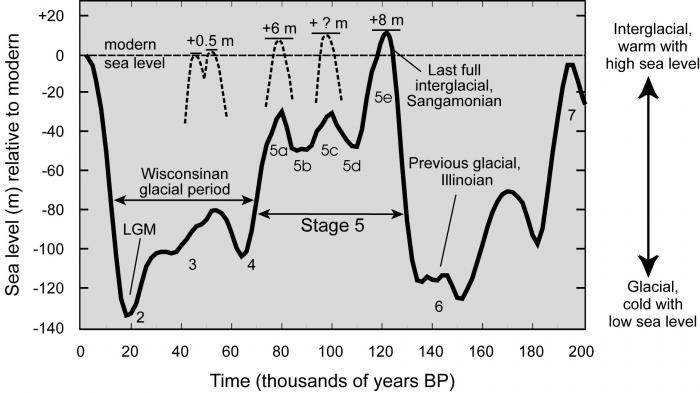
The figure below illustrates this very well. Take a look at the curve on the graph, obtained by analyzing oxygen isotopes in ice cores. It represents the fluctuations in sea level from 200,000 years ago to the present (going from right to left on the x-axis). Approximately 125,000 years ago, the sea level was approximately 8 meters higher than it is today. This was during the Sangamonian Interglacial, the last time the north polar ice cap completely melted. After this peak in sea level, ice returned to the planet. And the Wisconsinan Glacial period followed between 80,000 and 20,000 years ago when a glacial maximum, and sea level low stand (more than 130 m lower than today) took place. This is what most people mean when they refer to the "ice age". Glaciers covered much of North America. Following the glacial maximum, we see sea levels rising rapidly - the curve is about as steep as the one leading up to the Sangamonian Interglacial. It began to level off about 5,000 years ago, leading to fairly slow sea level rise in recent geologic time and the sea level human society has been accustomed to.
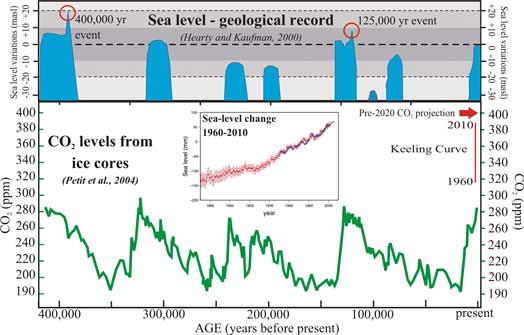
The figure above (Hearty) illustrates the CO2 fluctuations over 400,000 years and the rapid rise to the recently reached 400 ppm level (Keeling curve). These levels are unprecedented during the past 800,000 years. During the Sangamonian interglacial period mentioned above, at about 130,000 years ago, levels reached 300 ppm, but sea level was much higher than today. A CO2 level of 400 ppm occurred in the Pliocene 3 million years ago, when sea level is estimated to have been 10 to 40 m higher than it is now. The concern is that, based on evidence provided by paleoclimate studies such as those illustrated in the two figures above, this rapid increase in CO2 levels can be correlated with the melting of ice sheets leading to an ice-free planet. This melting is currently being watched closely. If all of Greenland’s ice were to melt, an increase of 5-7 m in sea level would be experienced. This is predicted to lead (as well as flooding of all coastal cities on the globe) to the disruption of the circulation of ocean currents (due to the rapid addition of huge volumes of freshwater to the ocean) that currently dictate the climate patterns as we know them in Earth. Of course, the implications of this scenario are huge. Stay tuned, and pay attention when you hear of news related to this phenomenon.
We will return to the ideas presented in these graphs after considering the complex cause and effect mechanisms that control sea levels on the planet.