Sea Level Change: What are Anomalies and Why are They Used in Climate Change Analysis?
If you are interested in understanding climate change, and you pay attention to in-depth news stories on the topic, you have no doubt frequently heard or read references to sea level and temperature anomalies. Anomaly data are being shared with greater regularity in the media these days, so it is important to understand what we mean by terms like sea surface temperature anomalies and sea surface height anomalies. An anomaly is an inconsistency or deviation from the norm, so images are created to show where change is taking place in the ocean in either a positive or negative trend when comparing to previous data. This is sometimes referred to as Sea Surface Height Deviation data or SSHD. Sea surface height anomalies are calculated using data from satellite altimeters. Many years’ worth of thousands of measurements provide a historical mean sea surface height, and the difference between the historical mean and the sea surface measurement for a particular date is called the sea surface height deviation. This can be calculated for points over the ocean surface, providing the data for the incredible maps we are seeing that show color-coded variations in sea surface across the globe and the changes in these measurements over time and space.
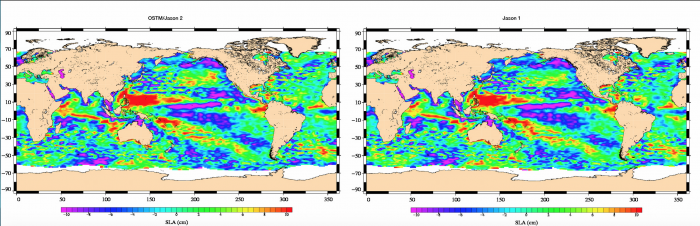
In the figure below, the data show the sea surface height differences compared to the 1961 – 1990 average over the entire planet. By comparing sea surface height measurements for a particular time period with the average measured over a previous time period, the changes can be shown spatially. In the figure below, the warm colors are sea surface heights that are significantly greater than past measurements, while the cool colors are those areas showing significantly lower elevation in the sea surface. This is how sea level rise trends can be identified in different parts of the globe using satellite data.
Revisit the NASA animation "22 Years of Sea Level Rise Measured from Space" from the Module 4 Overview that shows a 22-year period of sea level change using anomaly data. It is an excellent quick visualization of these phenomena.