Recent Sea Level Rise and Anthropomorphic Impacts
In the human timeline, the change from higher rates of sea level to lower rates of sea level rise coincided with the onset of the Neolithic interval ~4,000 years ago. Although human beings began to influence Earth in interesting ways within the last few millennia, (think Roman Empire, which began to expand about 2,000 years ago), anthropogenic impacts on sea levels likely occurred more recently. Feedback loops often have significant lag times.
As human populations grew and the demand for freshwater for agriculture and other industries increased, and as forests were deforested, significant volumes of water re-entered the ocean-climate system and contribute to sea level rise. Some calculations suggest that perhaps as much as 5 percent of the sea level rise observed in the last few decades may be from these sources.
Recommended Reading
This National Geographic News article "Groundwater Depletion Accelerates Sea-Level Rise" is related to this topic.
In 2016, the Earth’s atmospheric carbon dioxide concentration reached the 400 parts per million threshold level. This was highly significant to climate scientists and all people concerned about the effects of climate change on the planet. The amount of CO2 in the atmosphere has increased from about 280 ppm since 1750 AD at the beginning of the Industrial Revolution to its current level of 420 ppm. This is significant because of the observed effect that these increased levels of, a powerful greenhouse gas, have on the warming of the atmosphere and in turn the ocean.
Climate scientists agree that this steady increase in carbon dioxide levels (as well as other greenhouse gases – water, methane, nitrous oxide) is the cause of the warming of the planet. The burning of fossil fuels by humans over the past few centuries has “unleashed vast reservoirs of fossil carbon stored in the Earth for hundreds of millions of years.” (Hearty). When the concentration of these compounds increases in the atmosphere, so to do global temperatures, as greenhouse gases limit the escape of long-wave radiation (thermal energy). These interactions result in a warmer climate, which means more glacial ice is being melted. When combined with more water released into the ocean, warmer ocean waters also expand in volume and result in higher sea levels.
If we look at the Earth’s history, it is extremely rare for Earth to have 400 ppm of carbon dioxide in its atmosphere. Paleoclimate research using ice core data shows that about 3 million years ago the atmosphere contained 400 ppm carbon dioxide. Then the sea levels were 10 – 40 m higher than today. In more recent Earth history, 800,000 years ago, during an interglacial period, there was 300 ppm CO2. As we discussed above, ice core data show that fluctuations in the Earth’s sea levels parallel atmospheric CO2 levels.
All this is evidence for the argument that as we continue to pour more CO2 into the atmosphere with continued fossil fuel energy reliance, we can expect sea temperatures and sea levels to continue to rise in tandem with the CO2 concentration. There are many other implications that go along with this scenario. We must remember the positive feedback mechanisms, such as that in which the melting of Arctic ice reduces the albedo effect – or the reflective nature of the white snow and ice. These types of mechanisms have the effect of accelerating warming and therefore increasing the melting of ice and, in turn, increasing sea levels.
Let’s look at the data from tide gauge records, graphed over the entire 20th century and into the 21st Century. The graph below represents a composite of 23 tide gauge records from around the globe for the last century (1880 to 2000), and altimetry data superimposed since 2000 (red line).
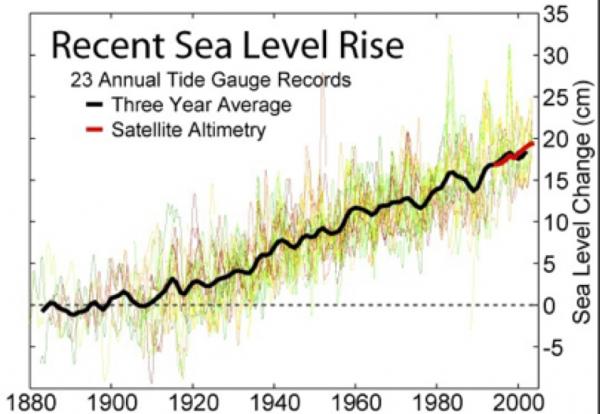
Each individual record shows the volatility (ups/downs) in water levels attributed to seasonal sea level changes that we have also previously discussed. To reduce this volatility, scientists employ a statistical averaging technique that calculates the average sea level of each successive three-year interval for all sites and then plots the average point on the graph. In this case, the moving average line is represented by the thick black line. Although it is still "wiggly," it is much smoother than the highly wiggly lines from which it is derived. This technique helps to "see the forest through the trees," so to speak.
Although a clear trend is visible in the 12 decades of data, the smoothed record helps to identify longer-term trends that are obscured by the highly variable local datasets. In this case, you will notice that there are essentially two modes in the longer-term trend. The first mode lasts roughly from 1880 through 1920, with a fairly stable sea level. In fact, the average sea level for this interval is used as the datum for this graph.
By 1920, the rate of sea level rise accelerates, and water levels begin to rise at a relatively constant rate through 2000 when satellite altimetry methods and data (red line) become available and help to substantiate tidal gauge methods.
These data show that sea level has risen an average of 20 cm (200 mm) over the last 80 years. This equates to a sea level rise rate of about 2.5 mm/year for the 80-year interval. If we take another look, including data collected since 2000, NOAA scientists show that the rate is accelerating again and a rate of 3.2 mm/yr. Has been established as the most current estimate.
The International Panel on Climate Change (IPCC) has set an estimated projected sea level rise at between 0.5 and 1.5 m by 2100. Many scientists argue that this is a too conservative estimate.
These estimates are based largely on the thermal expansion of seawater as the ocean surface heats up. However, the possibility of a significant contribution from the melting of ice sheets in Greenland and East and West Antarctic is not currently an important factor in IPCC predictions. Stay current as this research develops and estimates are adjusted accordingly.