Sea Level in the Past 20,000 Years
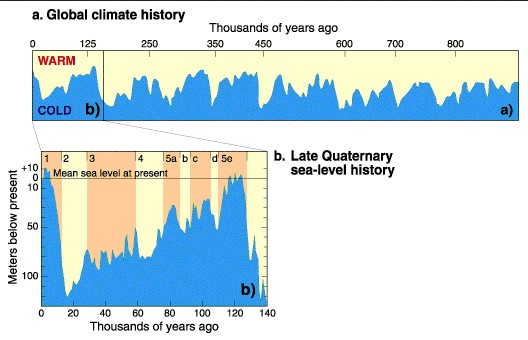
In order for us to connect sea level with our discussion on intrinsic and extrinsic controls and feedback mechanisms, etc., let's see another dataset that links climate history and sea level. The image below shows warm and cool periods for the last 900,000 years and has an expanded inset for the last 140,000 years.
In the inset, you will notice the long-term decline in sea levels from the last interglacial warm period, which occurred about 130 ky before the present. It is labeled stage 5e on the graphic. Sea levels declined to the lowest levels during stage 2 that occurred between 13,000 and 20,000 years ago. During this time, despite some minor short-term rise/fall events, sea levels fell from near modern sea levels to some 120 meters below present. The long-term rate of sea level fall calculation shows that sea levels fell 120 meters in approximately 100,000 years, or 0.12 m / 100 years. That is, sea levels fell by some 12 cm per 100 years, or through a simple unit conversion, the rate can be stated as 1.2 mm/year.
In the same graph, sea level rise appears to have been occurring at least for the last 18,000 years. Modern sea levels (relatively similar to highs 120,000 years ago) were achieved quite rapidly, relative to the rate of fall. Based on these numbers, 120 meters of sea level rise appears to have occurred in 18,000 years. This represents a rate of almost 6 mm/year for a rise rate.
This asymmetrical pattern of sea level rise/fall rates is repeated again and again for many of the earlier glacial-interglacial episodes. Thus, there is evidence that shows sea level fall (and building of ice sheets) is a long, drawn-out process where cooling and various positive feedback loops help to reinforce the cooling. The end result is an extended period of sea level fall (i.e., iteratively more albedo, and less and less insolation delivery, more cooling, etc.).
Conversely, once the factors that initiate warming begin to turn on, warming and associated sea level rise apparently can proceed at a much faster rate until a maximum sea level is reached, and factors that influence cooling initiate and bring sea levels down again.
Prior to the last few centuries, the system was controlled primarily by extrinsic and intrinsic variables. However, human impacts on landscapes, oceans, and climate (i.e., deforestation, greenhouse gas concentrations, nutrient runoff, aerosol pollution, and cloud development, etc.) have added variables that weren't present at any previous time (more on this later).
Now, let's look at a couple of more composite analyses that help us understand signals and signatures from the last few 1000 years. In the graphic below, a number of different datasets from Australia, South America, the Caribbean, the western Pacific, and other areas have been plotted to show sea level positions. Most of these datasets are derived from investigations of coral reefs that have drowned as sea level has risen.
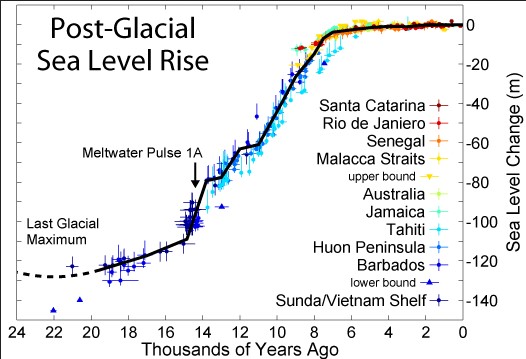
From what is observed in the figure above, sea level rise rates appear to have been relatively low during the initiation of rise (i.e., from 20,000 to approximately 15,000 years ago), at which point a significant increase in sea level rise rates (Meltwater Pulse 1A), and several others ensued. Three rapid increases in rise rates ("pulses") are noted here so that the majority of the 100 meters of sea level rise occurred from 14,000 to approximately 8,000 years ago, or 90 meters in roughly 6,000 years. This yields a sea level rise rate of 0.015 meters per year or 1.5 centimeters per year or 15 mm per year.
This is an incredibly fast rate that is tied to the decay of large ice sheets, including both the Eurasian and Laurentide Ice Sheets. The Laurentide Ice Sheet on North America had mostly retreated from North America by 6,000 years ago, leaving behind only the alpine ice sheets. Check out the video below showing the retreat.
Video: Laurentide Ice Sheet (00:32) No audio.
The Deglaciation of North America 21,400-1,000 years ago.
After Arthur S. Dyke, “An Outline of North American Deglaciation…” 2004. With additions from, “The Last Great Ice Sheets”, Denton & Huges, ed., 1981. Coastlines estimated using Barbados sea level curve after Bard et al., 1990. Great Basin Lakes from Curry, Atwood, and Mabey, “Map 73: Major Levels… Lake Bonneville” 1984.
[Animated map of North America shows the Laurentide Ice Sheet dramatically receding toward the northeast from 21,400 years ago, to 1,000 years ago.]
For more information
Check out Vignettes: Key Concepts in Geomorphology, for more info on Laurentide Ice sheet decay.
As these large ice sheets and their albedo potential were removed, the rate of absorbance of incoming solar radiation was likely to have contributed to further warming and increased temperatures of seawater. Thus, geoscientists are increasingly confident in the two primary factors that have contributed to the sea level rise rate prior to human influences. The primary cause is thought to be tied to thermal expansion of seawater, as we discussed previously. The second is the role of melting glaciers and increased volumes of land-ice being moved to the oceans.