Modeling Sea Level Changes
How do the IPCC and other agencies arrive at these numbers: Current rate of sea level rise: 3.2 mm/ year (Source: NASA: Global Climate Change); Sea Level rise predictions: 0.2 – 2.0 meters rise by 2100 (NOAA)? The numbers, which are frequently adjusted and may vary according to the source, are achieved using modeling methods of different kinds.
Earth System Models integrate the interactions of atmosphere, ocean, land, ice, and biosphere to estimate the state of regional and global climate under a wide variety of conditions. They numerically model the atmosphere, oceans, land, and sea ice, and have biogeochemical components (for example, dynamic global vegetation models) to study the carbon cycle.
Earth System Models of Intermediate Complexity (EMICs)
Models of intermediate complexity bridge the gap between conceptual models with many simplifying assumptions, and extremely complex, three-dimensional models that attempt to include as many known processes as possible. (Source: NASA: Sea Level Change)
The data gathering by the many satellite missions described above is producing datasets that are used to populate the models. Modeling ocean and sea surface height is responsible for the creation of the incredible simulations seen in this module.
Although models can help tremendously in understanding complex interactions among components of Earth systems and their outcomes, they are never perfect, and all are given ranges of confidence due to uncertainty. They must be compared to observations to iron out their inherent errors. The challenges involved in modeling the contributions of the ice sheets to sea level rise have reduced the ability to provide a full picture of what is happening in the oceans. This area is a growing field, and we are likely to hear about breakthroughs in modeling these aspects of climate change in the near future. The figure below shows sea level curves based on the IPCC AR4 report, which estimates a sea level rise of 0.8 meters by 2100.
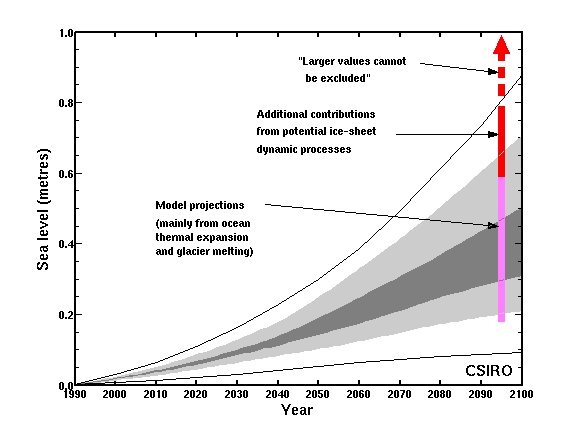
The figure above illustrates the levels of uncertainty that exist in the current data when using models to project future sea level rise. The AR4 IPCC data here show projected sea level curves through the year 2100. At 2095 the magenta bar shows a range of model projections (90% confidence limits), and the red bar shows the upper range extended to allow for the potential but poorly quantified additional contribution from a dynamic response of the Greenland and Antarctic ice sheets. Because there is a great deal of uncertainty surrounding the rates at which these ice sheets will melt in the future, a wide range of potential sea level rise scenarios are plotted. As the understanding of the mechanisms at work causing the melting of the ice sheets, the uncertainties shown here will most likely become more resolved in the future.