Measuring Sea Level
Measuring Sea Level Using Tide Gauges
Measuring sea level using gauges has a 200-year history. Today, the technology has changed, but the principles are the same as before, and some gauges provide very long and reliable records of water levels that can be used to observed sea level change trends. For example, the Fort Point tide gauge in San Francisco has more than 100 years of record that we will access later.
Sea level is often measured locally by tide gauges (and averaged over tidal cycles) that detect high and low points in a given period of time. Local tide gauges are especially useful for people who work or recreate in coastal areas and need to know what the water level ranges will be. These data points are also important for detecting water levels during storms and other events, as well as in the long-term investigation of relative water level change (rise or fall). Tide levels are also measured by floating buoys, which may also be used to detect tsunami waves. We will use tide gauge data to investigate sea level changes in different locations in the Module 4 Lab.
Measuring Sea Level Using Satellite Altimetry
With the advent of satellite altimetry in the 1960s, measurements of the sea surface took on a whole new level of accuracy. Between 1996 and 2006, altimetry took off with multiple satellites orbiting the Earth, providing much better coverage and data resolution. These measurements utilize multibeam methods that are very precise and can measure changes in elevation on the Earth's surface to great precision in the range of centimeters. These methods have shown that water bodies are not flat, but are incredibly dynamic and have high and low spots due to factors such as gravitational variability described above. Data such as ocean circulation, sea level rise, and wave heights can be measured. These measurements have provided insight into the links between the ocean and the atmosphere and how the connections drive climate. Satellite altimetry data collection began in earnest with the launch in 1992 of the TOPEX/Poseidon joint satellite mission between NASA and CNES, the French space agency. TOPEX/Poseidon proved data previously impossible to obtain. The next generation of satellites to collect these data was the NASA Jason satellites. They have been collecting data since Jason 1 was launched in 2001. Jason 2 was launched in 2008, while Jason 3 is presently collecting altimetry data. Each mission lasts about 5 years. Meanwhile, the European Space Agency’s Sentinel 3 satellite is collecting similar data, as shown below.
How Satellite Altimetry Works
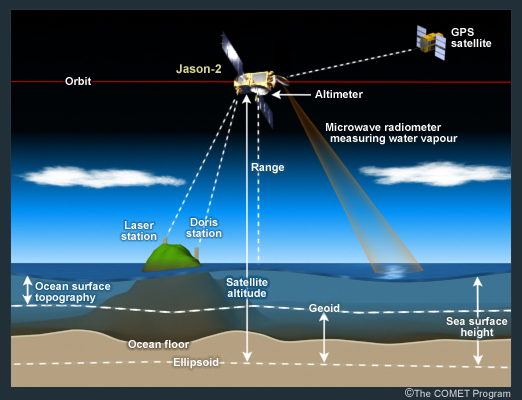
As the figure illustrates, satellite altimetry measurements are obtained by a system of instruments carried on a satellite orbiting the Earth. The instruments include an altimeter and antenna, which measure sea surface height; a radiometer, which measures atmospheric disturbances, and a GPS system for precisely determining the satellite’s location. The altimeter transmits rapid (1700/second) pulses of microwave energy towards the Earth, which reflect back to the satellite. The average round-trip time of these pulses is accurately measured to determine the exact distance between the satellite and the sea surface (range). Water vapor measurements are also made as the level of water vapor affects the rate of transmission of the pulses, and a correction must be made to obtain the final range, which is accurate to 2 cm. This range must be referenced to the reference ellipsoid, which is an approximation of the Earth’s surface (the sphere flattened at the poles discussed above). The GPS receiver onboard and ground-based radio receivers track the satellite’s exact location. Using these data, sea surface height can be accurately measured. In addition, the ocean surface topography (the highs and lows depicted on the images) are obtained through calculations. This information is key to understanding the ocean’s surface as a dynamic and complex terrain and to determining changes over time.
The Jason satellites have revealed critically important information that was not available prior to the mid-1990s. As technology develops and more data are added to the database, our understanding of the changing ocean increases. Among the many scientific goals of the Jason and other altimetry satellite systems currently in use, are to extend the time series of ocean topography measurements begun in 1992 and to monitor the changes in global mean sea level and its relationship to global climate change. Since the mid-1990s, there has been explosive growth in ocean and climate studies, and multiple altimetry satellites have provided longer and more accurate measurements and have led to better spatial and temporal coverage and resolution. These accurate and detailed measurements, in turn, inform predictive science on sea level change.
In addition, important information on ocean circulation and the relationships between heat transport and other variables such as nutrients and salt content are obtained, as well as measurements of wave height. These data can be used in modeling that informs our understanding of tides, weather, and other dynamic phenomena at work on our planet. This technology continues to add knowledge and understanding of our ocean.
Recommended Reading
More detail on the Jason mission can be found at Jason-3 NASA Sea Level Change Portal.
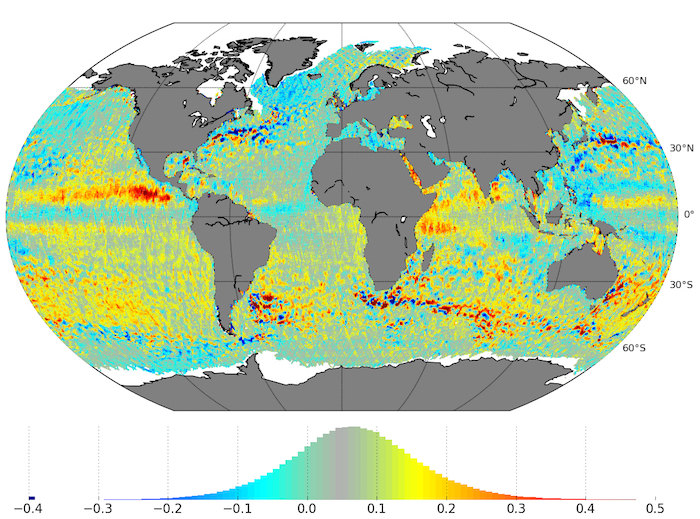
The uneven nature of the surface of the ocean is expressed in the maps below. These images were compiled from satellite altimetry data to show anomalies in sea levels and temperature. These types of data are used in sea level predictions. The complex science involved in tracking sea levels is evolving rapidly as it answers a pressing need to provide accurate predictions in a rapidly changing world.