
We already saw the pattern of projected change in rainfall. It is especially useful to look at this pattern averaged zonally, i.e., by latitude bands, which provides a simpler picture of how rainfall is projected to change as a function of latitude. When we do that, we see a fairly clear latitudinal pattern emerge.
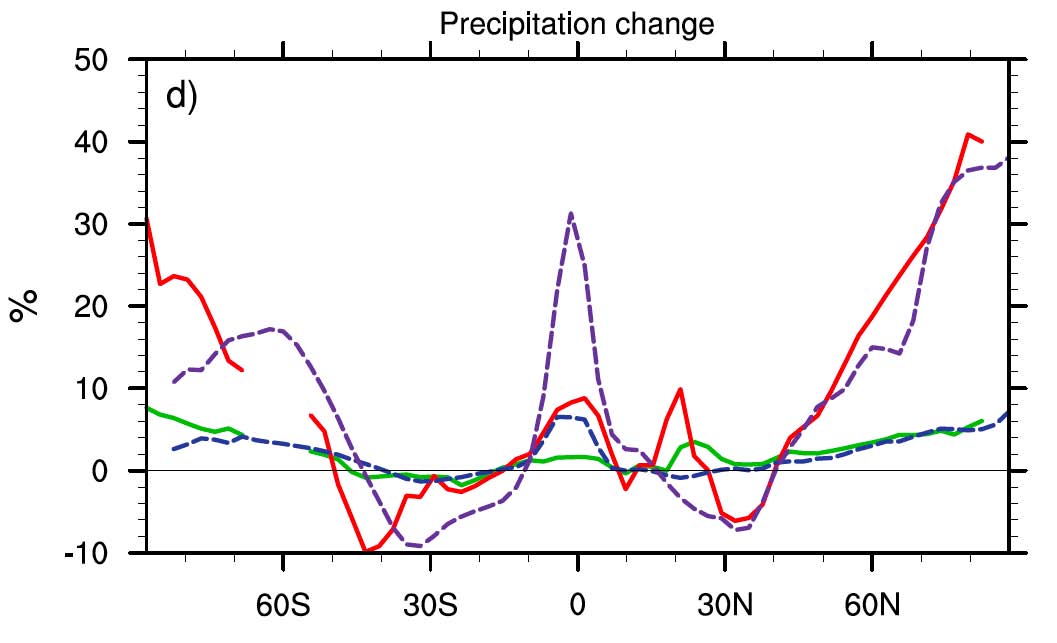
Here we see the increase in precipitation near the equator where the ITCZ lies, decreases from the sub-tropics through the mid-latitudes as the Hadley Cell expands poleward, and increases again in subpolar latitudes where the polar front migrates poleward. In short, we are seeing the effect of the poleward shifting of the zones of rising and descending motion that we reviewed during the overview of atmospheric circulation in our very first lesson.
© 2015 Pearson Education, Inc.
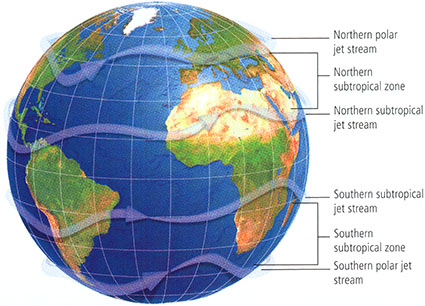
We first encountered the notion of a potential poleward migration of the jet stream in our previous discussion of the 2003 European heat wave, which was a possible harbinger of climate change impacts to come. In this particular case, the subtropical jet stream (which lies above the descending limb of the Hadley Circulation in the subtropics, and is associated with the subsidence of warm, dry air in the subtropics) shifted well north of its usual summer location over the northern Sahara desert and southern Mediterranean, well into the middle and even subpolar latitudes of Europe. That single event encapsulated a pattern that is expected to become more prevalent with future climate change, as the various atmospheric bands, including the Hadley Circulation, and polar front, expand poleward.
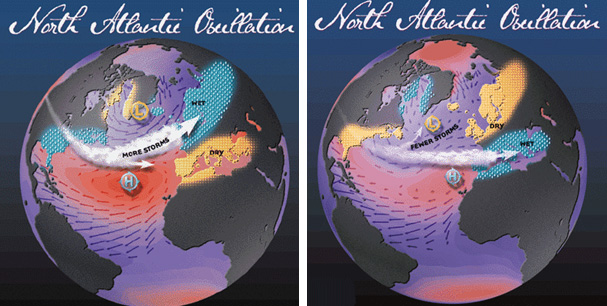
It is worth looking more closely, in this context, at one particular metric of the latitudinal shift of the polar front and jet stream, the North Atlantic Oscillation (NAO; we introduced this concept briefly in our discussion of factors influencing Atlantic tropical cyclone activity in Lesson 3). The NAO is a measure of the poleward extent of the Northern Hemisphere jet stream and polar front during northern winter over the North Atlantic Ocean. A positive NAO reflects a stronger than usual subpolar Icelandic low surface pressure center and stronger than usual subtropical Bermuda/Azores high surface pressure center during the northern winter. It is associated with a strengthened and more northerly storm track. It is associated with warmer and wetter than usual conditions in Europe. By contrast, the negative phase of the NAO is associated with a weaker than normal jet stream, cooler, dryer winters in Europe, and wet winters in the Mediterranean and near/Middle East.
Often the NAO is associated with a more hemispherically-symmetric mode of atmospheric variability known as the Arctic Oscillation (AO) or Northern Annular Mode (NAM), which reflects a deeper than usual surface low pressure area throughout the subpolar belt of the Northern Hemisphere, and a deeper than usual surface high-pressure area throughout the subtropical belt of the Northern Hemisphere. The positive mode of the AO/NAM is associated with a stronger Northern Hemisphere winter jet stream, while the negative phase is associated with a weakened jet stream.
Climate models project a trend towards a more positive winter NAO/AO/NAM as a result of anthropogenic climate change, due to the changing vertical and latitudinal patterns of temperature (as you may recall from our introductory readings, it is the vertical and latitudinal gradients in atmospheric temperatures which drive the jet stream in the first place). This implies a stronger winter jet stream in the Northern Hemisphere (similar changes are projected for the Southern Hemisphere), and stronger surface westerlies in middle latitudes. The stronger westerly winds at the surface further warm winter temperatures over land regions by spreading heat from the relatively warm oceans over the relatively cold continents. A more positive NAO also leads to a relative increase in winter rainfall in the southeastern U.S. and Northern Europe, and dryer conditions in the near and Middle East and southern Mediterranean. Given that these regions are currently stressed for their limited available water supply, this projected climate change response could represent a substantial threat to water security in these regions.
Monsoonal circulation patterns may also change. The most prominent of the monsoons is the South Asian Summer monsoon, which is the source of much of the annual rainfall in heavily-populated regions such as India. The monsoon is driven primarily by the contrast in heating of the oceans and land. The land responds more strongly to summer heating than the oceans, leading to a tendency for a very large-scale thermally-driven circulation cell, similar in some respects to the Hadley Circulation. There is rising motion inland over the Tibetan plateau and sinking motion over the Indian Ocean, so moist warm air over the Indian Ocean is drawn in toward the land, where it rises and condenses out water vapor. This circulation pattern can be influenced by a number of factors, each of which may be altered by anthropogenic climate change. For example, the differential heating of land relative to ocean, projected over the next century, could drive a stronger monsoonal circulation. On the other hand, increased atmospheric stability in South Asia due to latent heating of the atmosphere arising from condensing water vapor in the rising limb of the monsoon could stabilize the vertical temperature profile, inhibiting the Monsoonal circulation. In state of the art models such as those assessed by the IPCC, this latter factor tends to dominate, and the South Asian Summer monsoon is projected to weaken. Seemingly paradoxically, however, the monsoonal precipitation is projected to remain either stable or even increase. In the face of a weakening Monsoonal circulation this has to do with the fact that even though the circulation may be weakened, there will be greater water vapor content in a warmed atmosphere, leading to the potential for greater amounts of rainfall for a given circulation strength. There is still quite a bit of uncertainty on this, however, and a wide spread in projected behavior is seen among the models assessed by the IPCC.
Another pattern of atmospheric circulation that may potentially change as a result of anthropogenic climate change is the Walker Circulation, which we discussed in our introduction to the ENSO phenomenon. We will defer any discussion of the uncertain potential changes in this atmospheric circulation pattern to a later section discussing potential change in modes of atmospheric-ocean variability.
Of course, it is not only the atmosphere which is projected to change in its circulation patterns as a result of anthropogenic climate change, but also the ocean.