Prioritize...
At the completion of this section, you should be able to name the three conveyor belts associated with a mature mid-latitude cyclone. You should also be able to describe each conveyor belt and discuss its impacts on the mid-latitude cyclone (precipitation, appearance, etc.).
Read...
One of the common characteristics of mid-latitude cyclones is their distinctive appearance on radar and satellite imagery. In fact, visual cues from radar or satellite imagery can give weather forecasters clues about what's "going on" with a cyclone. For example, as a cyclone is being born (a weak low forms along a stationary front), the cloud structure of an infant low often resembles a leaf on a tree on geostationary satellite imagery. Forecasters call this a "baroclinic leaf" (baroclinic is just a technical term that refers to large temperature gradients).
As a mid-latitude cyclone reaches maturity (the occluded stage), most typically develop a network of three distinct, coiling air streams. Meteorologists call these streams conveyor belts. Conveyor belts associated with a maturing low are a bit complicated to visualize because they transport air in both horizontally and vertically, but this short video (2:59) should help you visualize these air streams (video transcript). The video shows a three-dimensional model, which will give you a better perspective on how all three conveyor belts contribute to the circulation of a mid-latitude cyclone and help explain why mature mid-latitude cyclones often resemble the shape of a comma on satellite and (sometimes) radar imagery. Let's break down each conveyor belt and the role it plays in the cyclone in more detail (as we've been doing, we'll assume we're talking about mid-latitude cyclones in the Northern Hemisphere).
Warm Conveyor Belt
The warm conveyor belt transports warm and moist air northward from lower latitudes, steadily and gradually rising during its northward trek and eventually overrunning cold air north of the system's warm front, which helps to create stratiform clouds and precipitation. As it overruns the cold-air wedge on the northern side of the warm front, the warm conveyor belt can reach altitudes near 30,000 feet. Here, the warm conveyor usually encounters high-altitude winds from the west, and, in response, turns eastward. Meanwhile, the western edge of the warm conveyor belt gets drawn westward by the upper-level disturbance that is helping to spur the low-pressure system. As a result, a classic S-shape develops in the band of high clouds that mark the warm conveyor belt. Weather forecasters recognize this classic S-shape as a sign that the cyclone is mature.
Focus your attention on the water-vapor images below. The left image shows the developing Blizzard of 1993 at 12Z on March 13, 1993. In this case, the low's warm conveyor belt transported moist air from the Caribbean and Central America northward over much of the eastern U.S. The water-vapor image on the right shows a less spectacular (but still classic) warm conveyor belt of a mature low-pressure system in March, 1996.
Dry Conveyor Belt
On each of the images above, notice the dark swath on the water vapor image west of the back edge of the warm conveyor belt. As you recall, dark shading on water vapor imagery represents areas where the effective layer is warm and relatively low (likely in the middle troposphere), which implies that the upper troposphere is dry. This drying of the mid and upper troposphere is indicative of air sinking from great altitudes where water vapor is scarce. In the case of a maturing low-pressure system, dry air near the tropopause sinks west of the low's center (keep in mind that upward motion characterizes the region around the center of the low so that there is a natural tendency for the air to sink further west). Upon descent, this dry air starts to wrap counterclockwise around the low's periphery, helping to scour out clouds and thus creating what weather forecasters call the dry slot west of the cold front.
This stream of dry air that sinks from lofty altitudes near the tropopause and then wraps counterclockwise around a mature low-pressure system is called the dry conveyor belt. The dry conveyor belt helps to give a classic "comma" shape to the mass of clouds generated by a mature low-pressure system. However, for the full effect, we need to discuss how the clouds that compose the comma head west of the surface low's center are formed.
Cold Conveyor Belt
The cold conveyor belt helps create the clouds that compose the comma head. The cold conveyor belt is so named because it is responsible for westward transport of cool, moist air north of the warm front and back into the cold air west of the low. While the warm conveyor belt takes the high road north of a low's warm front, this cold conveyor takes a lower road. Like traffic moving under an overpass, a stream of cold air starts to move westward near the earth's surface on the northern side of the maturing low's warm front.
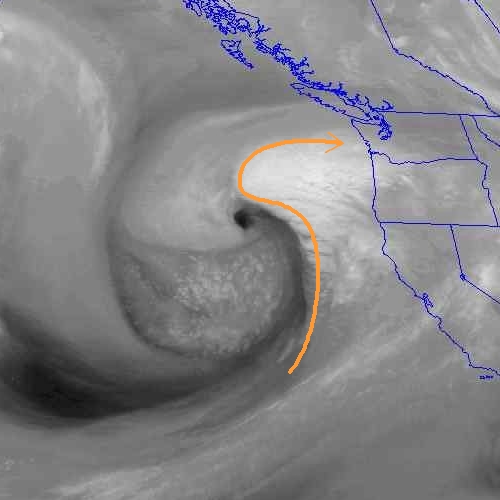
To see what I mean, check out this infrared satellite image on October 9, 2007, which shows a mature cyclone off the Pacific Northwest Coast. Note the lower, warmer cloud tops associated with the cold conveyor belt (compared to the warm conveyor belt). As the cold conveyor belt passes under the higher-flying warm conveyor, it gains moisture as some overrunning precipitation evaporates into its westward-moving stream of cold air (evaporation from underlying bodies of water can also moisten the cold conveyor).
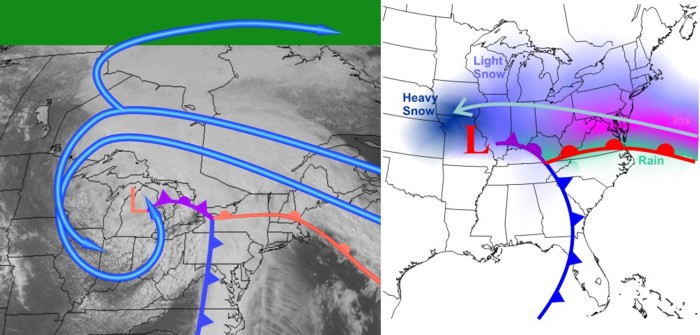
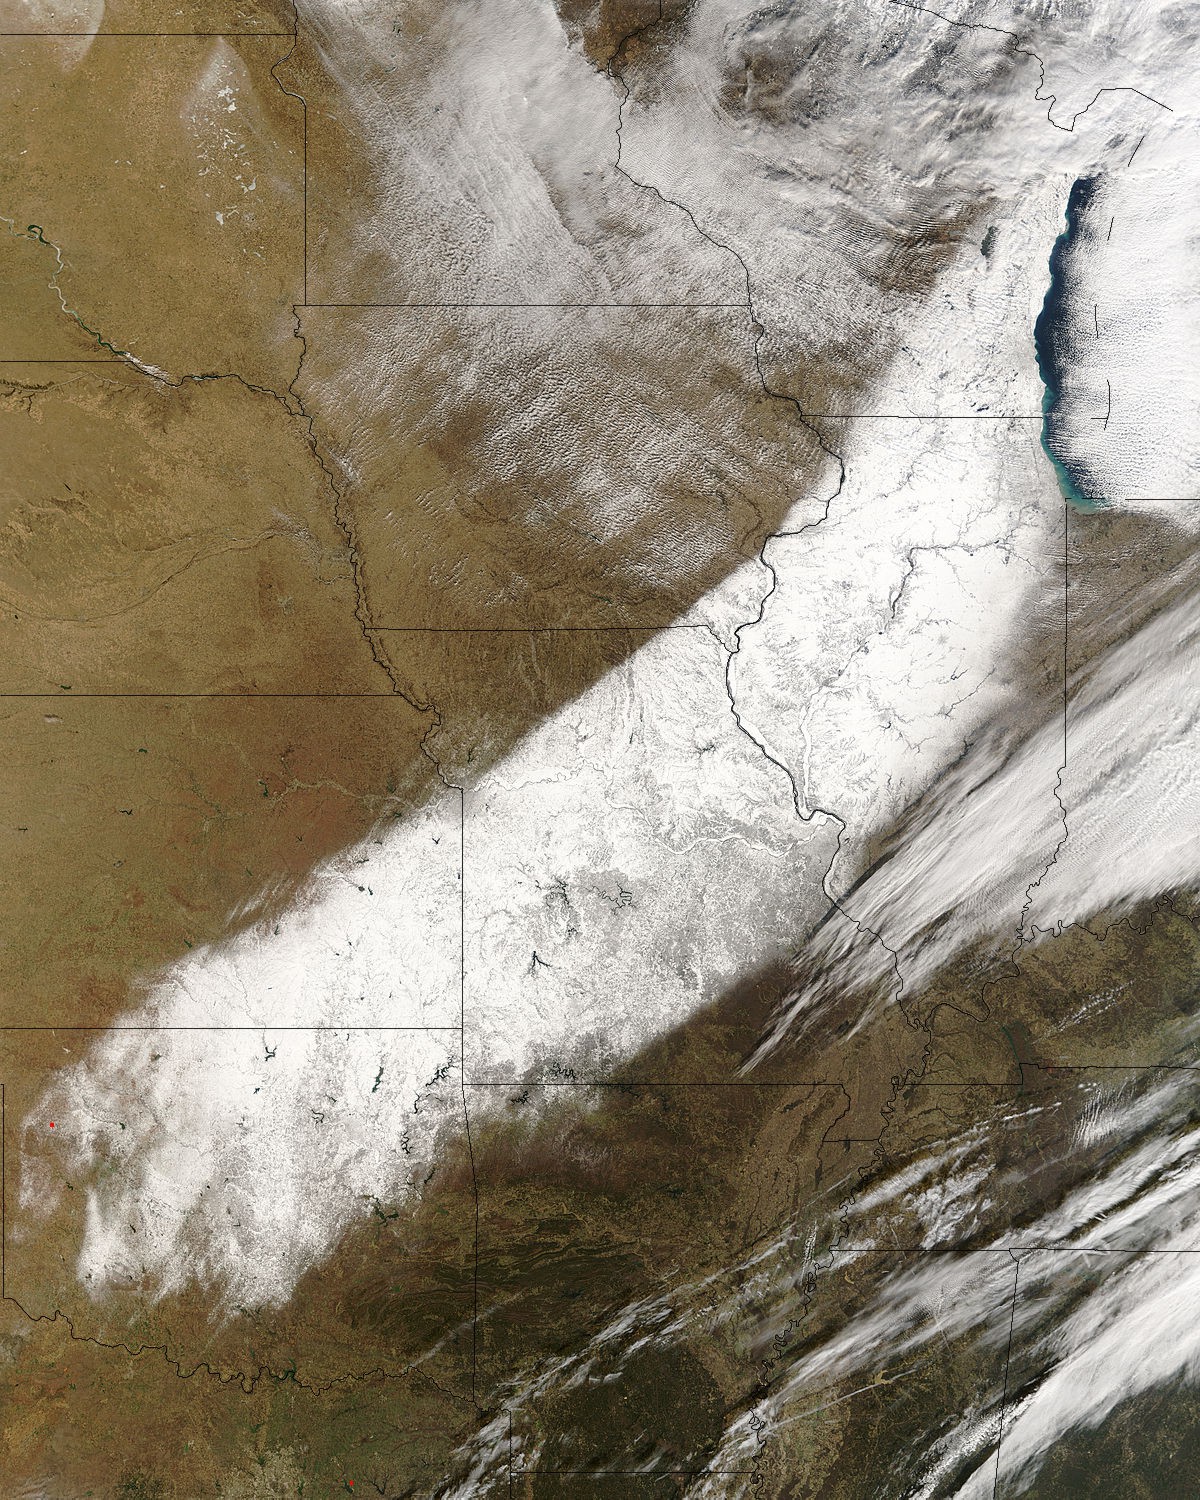
As the moistening cold conveyor heads westward, it starts to rise as it enters the general pattern of strong upward motion around the periphery of the low-pressure system's center (thanks to the pattern of low-level convergence and upper-level divergence that occurs near the center of the low). Strong ascent continues until the cold conveyor belt reaches the northwest flank of the low (approximately 75 to 150 miles northwest of the low's center). Here, the ascending conveyor of cold, moist air often contributes to a swath of heavy precipitation. In winter, the northwest flank of a maturing cyclone often marks a maximum in snowfall, owing largely to the influence of the cold conveyor belt. Powerful lows often leave a relatively narrow swath of heavy snow that you can sometimes observe on satellite imagery, like this swath of snow created by a powerful mid-latitude cyclone that moved up through the Midwest on December 1, 2006 (courtesy of VisibleEarth, NASA). These swaths of heavy snow typically coincide with the track of the favored northwest flank of the storm system.
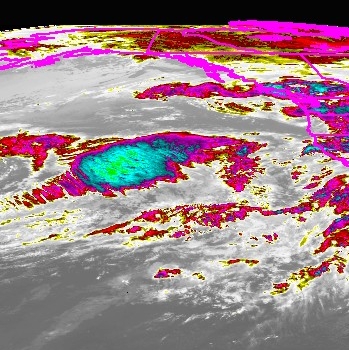
After reaching the northwest flank of a mature low-pressure system, the cold conveyor splits into two tributaries. One branch turns clockwise and then heads eastward. The other branch of the cold conveyor belt turns cyclonically as it heads southward, generating clouds that help to sculpt the comma head of a mature low-pressure system's cloud structure. These clouds often precipitate, inspiring some weather forecasters to refer to rain or snow falling from the coiling cold conveyor belt as "wrap-around precipitation." In this radar image of a Midwestern blizzard, the wrap-around precipitation is quite extensive and contributed to the blizzard conditions in Nebraska, South Dakota, and Minnesota. Farther south in a mature low's comma head, surface convergence produced by air swirling in toward the low's center helps to create rain or snow showers.
To conclude and summarize this section, watch the development of a classic cyclone and its cloud structure in this fantastic animation of satellite images from October 26-27, 2010. During the daytime, visible images document the low's development, while at night, infrared images appear, so don't be startled by the abrupt change. Do you see how the cyclone ends up resembling a comma? As you watch the video, try to identify the three conveyor belts that we have discussed in this section. To further help you identify the conveyor belts and connect back with the concepts you recently learned about fronts, check out the short video below (4:59), in which I take a "tour" of a classic mid-latitude low-pressure system.
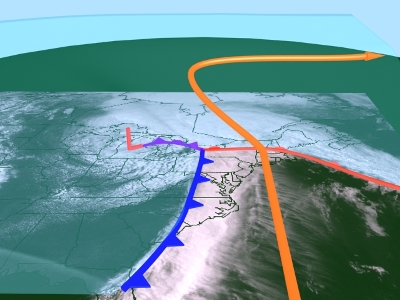
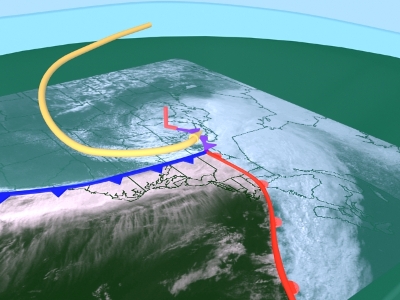
I want to take a tour of a surface low-pressure system and take a look at some of the different features so you can see how they fit together with a real weather system on real weather maps. We'll start at the surface. This is a surface analysis from 12Z on February 13, 2014. There was a 997 millibar low-pressure system along the East Coast, right along the North Carolina-Virginia border. This was a fairly significant storm, which dropped over two feet of snow in parts of the mid-Atlantic region. Heavy snow extended up into New England with localized blizzard conditions.
To the south of the surface low, we have this blue line with blue triangles. That's the cold front signaling the leading edge of advancing colder air. Out ahead of it, in the warm sector, we often have a maritime-Tropical air mass, which is warm and humid. Behind it, we have an advancing colder air mass, commonly continental polar, or even continental Arctic. And we can see some huge temperature contrasts here. To the east of Florida, temperatures are in the 70s on these station models. Behind the front in northern Florida, we have temperatures in the 30s, so much colder air is arriving behind that cold front.
To the east of the low, the red line with red semicircles marks the warm front. That signals the boundary between retreating colder air to the north and advancing warmer air in the warm sector. It's the retreat of that cold air that actually allows the warm air to advance. So we have a maritime tropical air mass advancing northward while the colder, denser air north of the warm front, slowly retreats.
Now let's fast forward six hours to 18Z, and the low is even stronger now, around 991 millibars. The center of the low has moved northward off the Delaware Coast, and we just see the very beginning of an occluded front forming. It's hard to see, but the beginning of the occluded front signals that the low is starting to reach maturity. The cold front is trailing southward offshore, while the warm front extends toward the east.
So, let's look at this mature low-pressure system on the corresponding enhanced infrared satellite image. To get your bearings, the greens, blues, and purples represent cold, high cloud tops. This cyclone has a classic comma signature to it, signaling that it's a mature mid-latitude cyclone. To the north of the warm front, we generally have upward motion from overrunning as the warm air glides over the dense cool air near the surface, which often results in a large area of layered clouds, which is what we see north of the warm front. These clouds near the northern edge of the cloud shield are quite high and cold.
But, a look at the corresponding visible image shows that they seem to be relatively thin, which fits what we would expect. We often have thin, high cirrus and cirrostratus clouds well north of the warm front, thicker altostratus clouds as we get a little closer to the warm front, followed by thick stratus and nimbostratus clouds close to the warm front.
Switching back to the enhanced infrared, we can see that along and just ahead of the cold front, we have a thinner band of clouds, which is indicative of the showery weather that typically accompanies cold frontal passages. Satellite imagery also lets us get a handle on this low's conveyor belts, and for that, we'll turn to water vapor imagery.
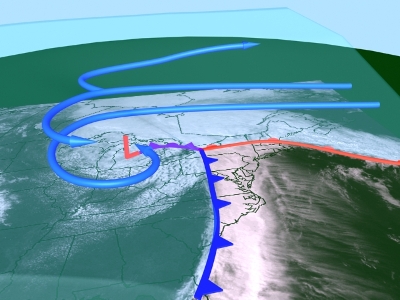
To get your bearings, here's the East Coast of the United States, and here's our cyclone. This stream of water vapor and clouds ushering moist air northward, which eventually overruns the colder air mass north of the warm front, is the warm conveyor belt. Meanwhile, the cold conveyor belt travels under the warm conveyor belt north of the warm front and rises as it wraps around the cyclone, to create the clouds in the comma head. Finally, we can see evidence of the dry conveyor belt, too. It helps define the western edge of the comma head as dry air aloft, marked by the dark ribbon here, sinks from aloft around the western edge of the storm, and wraps around the storm to form the dry slot.
Finally, here's the corresponding radar image. Unfortunately, we can't see much of the precipitation with this mid-latitude cyclone because the showers and storms along the cold front, along with much of the stratiform overrunning precipitation north of the warm front was outside of the range of land-based radars, although you can see a bit of the overrunning precipitation off the New England Coast. But, we can get a good look at the wrap-around precipitation associated with the cold conveyor belt, which was bringing snow from New England down through Pennsylvania, and even into Virginia and North Carolina, even though remember the surface low was off the Delaware Coast.
I hope you have the picture by now that mid-latitude cyclones are complex, three-dimensional features, which can cause a wide variety of weather (from various precipitation types to abrupt temperature changes to strong winds). In the colder months, mid-latitude cyclones can be responsible for a variety of precipitation types, from rain to freezing rain, to sleet, to snow. Each of these brings its own hazards, and I think it's important that you understand how each type forms and where each type tends to fall within a winter mid-latitude cyclone. Read on.